Wave Analysis from InstaForex

Technical analysis of USD/JPY for Dec 07, 2017

In Asia, Japan will release the Leading Indicators and 30-y Bond Auction data, and the US will release some Economic Data, such as Consumer Credit m/m, Natural Gas Storage, Unemployment Claims, and Challenger Job Cuts y/y. So, there is a probability the USD/JPY will move with a low to medium volatility during this day.

TODAY'S TECHNICAL LEVEL:
Resistance. 3: 113.02.
Resistance. 2: 113.80.
Resistance. 1: 112.58.
Support. 1: 112.30.
Support. 2: 112.08.
Support. 3: 111.86.

Analysis are provided by InstaForex
 
Euro and pound will be determined with direction

Eurozone
The euro area economy continues to expand at a steady pace, GDP growth in Q3 was 0.6%, at an annual rate of 2.6%, preliminary data was revised upwards, which is consistent with the overall economic trend.

Growth is primarily due to increased investment and exports. Despite the fact that household expenditures have decreased somewhat, the general level of optimism continues to improve, as indicated by the recent reports of ZEW and IFO.

On Wednesday, a report on industrial production will be released, on Thursday - PMI Markit index. This will be the latest data ahead of the ECB meeting, they will help to predict the overall tone of the commentary and the position of Mario Draghi at a subsequent press conference.

On Thursday, investors do not expect the ECB to decide to make any concrete steps, since there is no reason for this yet. However, forecasts for economic growth and inflation will be updated upwards, as indicated by both growing business activity in recent months and rising oil prices.

The euro as a reaction to the meeting of the FOMC may decline to a support level of 1.1670, growth is limited to the level of 1.1880.

United Kingdom

The pound on the eve of the meeting of the Bank of England on December 14 is seent to be positive. According to Halifax, housing prices have stabilized after more than a year of decline and activity in the construction sector decreased. The inflation forecast published by the Bank of England rose from 2.8% to 2.9%, the trade deficit instead of expanding has unexpectedly remained virtually unchanged. Sufficiently, the industry appears much better, which was clearly facilitated by the protracted period of the weak pound, which supported the export industries.

The industrial sector is growing for the sixth month in a row, on an annualized basis, growth was 3.9%, which is higher than expected

The National Institute for Economic and Social Research (NIESR) reports that, according to their calculations, UK GDP growth for the last 3 months was 0.5%, which exceeds both the indicators of the beginning of the year and 0.4% in the third quarter.

These factors increase the likelihood that the Bank of England will continue to gradually raise rates, and will also contribute to the growth of the pound. Although at the next meeting, the Bank of England will not raise the bid, the general trend is in favor of an increase, which is clearly a bullish factor for the pound.

On Friday, there was news that the UK and the EU agreed on three key points in the first phase of the Brexit talks. The border between Ireland and Northern Ireland was agreed upon, migration policies concerning the rights of EU citizens in the UK, and, most importantly, London's payment for the withdrawal from the EU. Thus, the first phase of negotiations is completed, and at the EU meeting on December 14, it will be possible to announce the progress achieved. This news will strengthen the positions of both the euro and pound.

The pound, nevertheless, will still be under pressure, since there are no serious internal drivers in the coming week. Presumably, a decline towards 1.3250 as an intermediate target and 1.2850 as a long-term goal.

Oil
China, which is the world's major oil consumer, supported the growing trend on Friday, posting significantly higher than expected trade balance data in November. Crude oil imports increased by 19.37% in November, demand remains firmly high, which, combined with a number of restrictive measures by OPEC + and significant financial losses of shale companies in the US, contribute to the formation of a stable demand against the backdrop of stable production in the context of the price war with OPEC. Together, these factors support oil, which allows us to predict a breakthrough of resistance at 63.50 for Brent in the short term.

*The market analysis posted here is meant to increase your awareness, but not to give instructions to make a trade.

Analysis are provided by InstaForex
 
BTC/USD reacting off our selling entry perfectly, remain bearish

Bitcoin has reached our selling area and is reacting off it nicely. We remain bearish looking to sell below 17459 resistance (Fibonacci extension, bearish price action, bearish divergence) for a drop towards at least 14739 support (Fibonacci retracement, horizontal overlap support).

Stochastic (34,5,3) is seeing major resistance below 98% and also displays bearish divergence vs price, signaling that a reversal is impending.

Reason for the trading strategy (fundamentally):

Bitcoin January futures (which are contracts that let investors buy or sell something at a specific price in the future) price are about $17,800 which is rather close to where we forecast major resistance. This is in line with the immediate resistance we're seeing on the technical side so it would be safe to start looking to short Bitcoin for a correction.

Sell below 17459. Stop loss is at 18770. Take profit is at 14739.

*The market analysis posted here is meant to increase your awareness, but not to give instructions to make a trade.

Analysis are provided by InstaForex
 
ECB leaves rates and economic forecast unchanged

The euro met with minimal hesitation at the key decision of the European Central Bank this week.

According to the data, the European Central Bank left the refinancing rate unchanged at 0.0%, while stating that interest rates will remain at current levels for a long time after the end of the asset purchase program.

Many experts expected that the ECB would make hints on the gradual tightening of monetary policy by the time of the completion of the curtailment of the asset repurchase program, which is scheduled for the end of next year. However, as we can see, this is not included in the plans of the ECB and there are a number of objective reasons for this. At the very least, this is the missing price pressure, which is kept quite low for quite a long time even after good economic growth in the second and third quarters of this year. The labor market in the euro area also shows growth but the rate of increase in wages is far from ideal.

The ECB also revealed that they will reinvest funds received from the redemption of bonds for a long period after the completion of the curtailment of the asset purchase program.

In the morning, preliminary data on the PMI supply managers' index for France's manufacturing sector for December came out. It rose significantly to 59.3 points versus 57.7 points in November. Economists had expected PMI for the manufacturing sector to be at 57.1 points.

A similar preliminary index of supply managers PMI for Germany's manufacturing sector for the month of December this year rose to 63.3 points against 62.5 points in November. Economists expected the index to fall to 62.1 points.

As for the euro area as a whole, the preliminary composite index of supply managers for the euro zone's PMI in December this year increased to 58.0 points with a forecast at 57.3 points, which is slightly lower than the November figure of 57.5 points. In the second half of the day, data on the US labor market came out.

According to a report by the US Department of Labor, the number of Americans who applied for unemployment benefits last week declined. Thus, the number of initial applications for unemployment benefits for the week of December 3 to 9 decreased by 11,000 and amounted to 225,000. Economists predicted that the number of applications would be at 235,000.

*The market analysis posted here is meant to increase your awareness, but not to give instructions to make a trade.

Analysis are provided by InstaForex
 
Inflation continues to grow in Japan

Weekends and holidays are always accompanied by a low volume of trades against the background of lack of important fundamental statistics.

Most likely, serious and purposeful movements will not be formed in the pairs EUR/USD and GBP/USD before the end of this year.

Some leading experts expect that the growth of the US economy next year will significantly accelerate due to the approved program of tax cuts, and also due to an increase in government spending. Do not forget that at the end of last week, US President Donald Trump signed a new tax bill with a total cost of $ 1.5 trillion, which the budget will not be counted on.

According to economists of Goldman Sachs, the measures taken by the White House administration will lead to a larger GDP growth in 2018. According to the data, the US GDP in 2018 will grow by 2.6%, and 1.7% in 2019. These data were revised upwards by 0.3% and 0.2%.

Economists of J.P. Morgan also expects more significant growth in consumer spending, which will stimulate the economy of the country, adding to the previous forecast of 0.2%. In J.P. Morgan forecasts, the US GDP growth of 2.1% next year.

As for the technical picture of the EUR/USD pair, it did not change significantly compared to the forecast at the end of last week. Only a confident exit to the resistance level 1.1880 will lead to the formation of a new upward wave, with an update of the monthly highs of 1.1900 and 1.1935.

The data on consumer price growth in Japan did not lead to significant changes in the USD/JPY pair, even despite the increase in the index which is a positive sign for the Bank of Japan.

According to the report of the Ministry of Internal Affairs and Communications of Japan, the base consumer price index in November rose by 0.9% compared to the same period of the previous year after an increase of 0.8% in October. While economists expected the index to grow by 0.8%.

The general consumer price index rose by 0.6% in November after rising to 0.2% in October this year. Economists predicted an increase of 0.5%.

Despite the lack of strong impetus, prices continue to grow for 11 consecutive months, which makes the Bank of Japan feel more relaxed.

The index, excluding the prices of fresh food and energy, rose by 0.3% compared with the same period in 2016 after an increase of 0.2% in October.

Today, the unemployment rate in Japan in November 2017 fell to 2.7% from 2.8% in October, as the number of jobs increased. As indicated in the report, there were 100 applicants in November who had 156 jobs compared to 155 in October.

* The presented market analysis is informative and does not constitute a guide to the transaction.

*The market analysis posted here is meant to increase your awareness, but not to give instructions to make a trade.

Analysis are provided by InstaForex
 
Wave analysis of the EUR / USD currency pair for December 29, 2017

Analysis of wave counting:
In a thin inter-holiday market, the EUR/USD pair was able to add about 60 pp in price and re-tested to the level of the 19th figure in the second half of yesterday. It can be assumed that the currency pair has reached the final stage of the formation of the wave c, in b, in c, in a, in (C). If this is the case, the pair can resume reduction quotes and mark the beginning of a future wave in a, and in (C) after virtually reaching the highest level achieved yesterday or after the growth to the level 1.1920-1.1930.

Objectives for building a downward wave:
1.1736 - 38.2% by Fibonacci
1.1666 - 23.6% Fibonacci retracement
Goals for building an upward wave:
1.1900
1.1918 - 11.4% Fibonacci retracement

General conclusions and trading recommendations:
The construction of the downward trend section continues, as well as the construction of the assumed wave b, in c, in a, in (C). If this assumption is correct, the quote will resume its increase with targets around 19 figures and the mark of 1.1918. Hereinafter, a decline in quotations may resume with the targets located near the calculated marks of 1.1736 and 1.1666, corresponding to 38.2% and 23.6% Fibonacci, and lower.

*The market analysis posted here is meant to increase your awareness, but not to give instructions to make a trade.

Analysis are provided by InstaForex
 
NZD/USD approaching major resistance, prepare to sell

The price is testing major resistance at 0.7188 (Fibonacci retracement, horizontal overlap resistance, bearish divergence) and a strong reaction could occur at this level to push the price down to at least 0.7041 support (Fibonacci retracement, horizontal pullback support). However, we are also in a bullish ascending channel and only a break of this channel would confirm further downside move.

Stochastic (34,5,3) is seeing major resistance at 94% and also displays bearish divergence vs price signaling that a reversal is impending.

Sell below 0.7188. Stop loss is at 0.7280. Take profit is at 0.7041.

Analysis are provided by InstaForex
 
Technical analysis of EUR/USD for Jan 11, 2018

EURUSD.jpg


When the European market opens, some economic data will be released such as Industrial Production m/m and Italian Retail Sales m/m. The US will present a series of economic reports such as Federal Budget Balance, 30-y Bond Auction, Unemployment Claims, Core PPI m/m, and PPI m/m. So amid the reports, EUR/USD will move with low to medium volatility during this day.

TODAY'S TECHNICAL LEVELS:
Breakout BUY Level: 1.2020.
Strong Resistance:1.2013.
Original Resistance: 1.2001.
Inner Sell Area: 1.1989.
Target Inner Area: 1.1961.
Inner Buy Area: 1.1933.
Original Support: 1.1921.
Strong Support: 1.1909.
Breakout SELL Level: 1.1902.

Disclaimer: Trading Forex (foreign exchange) on margin carries a high level of risk, and may not be suitable for all investors. The high degree of leverage can work against you as well as for you. Before deciding to invest in foreign exchange you should carefully consider your investment objectives, level of experience, and risk appetite. The possibility exists that you could sustain a loss of some or all of your initial investment and therefore you should not invest money that you cannot afford to lose. You should be aware of all the risks associated with foreign exchange trading, and seek advice from an independent financial advisor if you have any doubts.
 
Technical analysis of USD/JPY for Jan 17, 2018

In Asia, Japan will release the Core Machinery Orders m/m data, and the US will release some Economic Data such as TIC Long-Term Purchases, Beige Book, NAHB Housing Market Index, Industrial Production m/m, and Capacity Utilization Rate. So, there is a probability the USD/JPY will move with a low to medium volatility during this day.

TODAY'S TECHNICAL LEVEL:
Resistance. 3: 110.97.
Resistance. 2: 110.76.
Resistance. 1: 110.54.
Support. 1: 110.27.
Support. 2: 110.06.
Support. 3: 109.84.

Analysis are provided by InstaForex
 
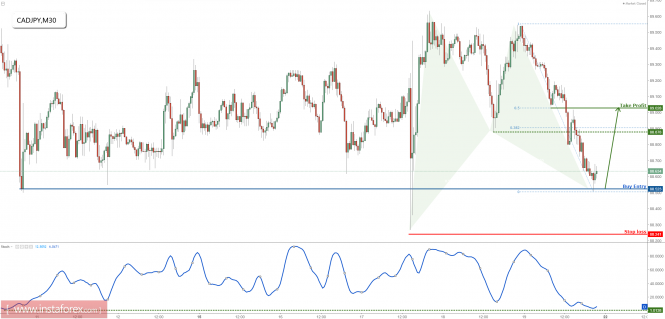
CAD/JPY testing major support, prepare for a bounce!

The price is testing major support at 88.52 (Horizontal swing low support, bullish price action, bullish harmonic formation) and we expect to see a nice bounce above this level to push the price up to at least 88.87 (Fibonacci retracement, horizontal pullback support) before 89.02 (Fibonacci retracement, horizontal overlap resistance).

Stochastic (55,5,3) is seeing major support above 1% where we expect a corresponding bounce from.

Buy above 88.52. Stop loss at 88.24. Take profit at 88.87 and 89.02.

analytics5a654d9c925cf.png
 
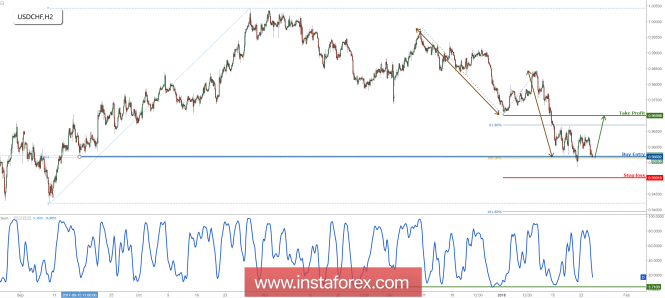
USD/CHF right on major support, prepare for a bounce

The price is now testing major support at 0.9569 (Fibonacci extension, horizontal swing low support) and we expect a bounce above this level to push the price up to at least 0.9699 resistance (Fibonacci retracement, horizontal pullback resistance).

Stochastic (21,5,3) is seeing major support above 3.7% where a corresponding bounce could occur.
Buy above 0.9569. Stop loss at 0.9501.
Take profit at 0.9699.

analytics5a680ce7c8b41.png


*The market analysis posted here is meant to increase your awareness, but not to give instructions to make a trade.
 
Pound updates annual highs on the background of the report on the labor market

The euro managed to strengthen against the US dollar in the morning against the backdrop of data indicating the likely retention of the euro zone's economic growth rates earlier this year. However, a serious breakthrough in important levels of resistance has not occurred, indicating a restrained demand for risky assets.

According to the IHS Markit report, Germany's economy continues to show good results in early 2018 due to the growth of activity in the services sector. So, the index of supply managers for the German services sector in January 2018 increased to 57.0 points against 55.8 points in December. Economists, on the contrary, expected a decline in the index. The index for the manufacturing sector in January fell slightly, to 61.2 points.

In the eurozone, there are also signs of stable growth, as evidenced by the data.

According to the IHS Markit report, the preliminary composite index of supply managers of the eurozone in January 2018 increased to 58.6 points against 58.1 points in December. It should be noted that the index values above 50 indicate an increase in activity. This growth in the index corresponds to a quarterly growth of the economy by 1%.

In France, the preliminary index of supply managers for the manufacturing sector in January this year dropped to 58.1 points against the December value of 58.8 points. But the preliminary index of supply managers for the services sector, on the contrary, increased in January to 59.3 points against 59.1 points in December. Economists had expected that the service sector index would drop to a level of 58.9 points.

As for the technical picture of the EURUSD pair, there have been no significant changes. The main objective of euro buyers today will be to keep above the 1.2300 area, which will make it possible to count on continuing the upward trend, with the update of the new significant highs of 1.2390 and 1.2430.

The British pound continued its growth against the US dollar, after it became known that the employment rate in the UK from September to November 2017 reached a record high. Meanwhile, wages in the UK declined, which indicates a worsening of the financial situation of consumers after the referendum on Brexit.

According to a report by the National Bureau of Statistics, the employment rate in the UK was 4.3%, which fully coincided with the forecasts of economists. The average earnings in the UK for the period increased by 2.4%, while real wages fell by 0.5%.

Analysis are provided by InstaForex
 
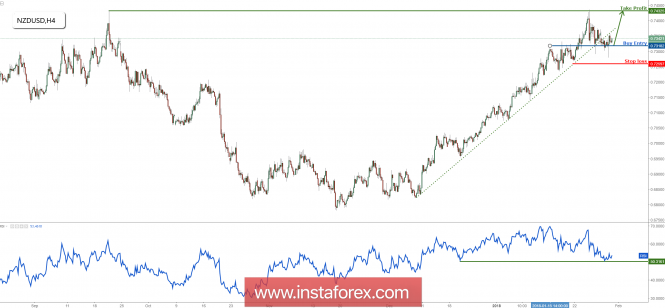
NZD/USD starting to show signs of a bounce, remain bullish

The price continues to test our buying area and ascending channel support. We think that it might be doing a fake breakout now because RSI has not broken below 50% yet. We remain bullish above major support at 0.7312 (Fibonacci retracement, horizontal overlap support, long-term ascending support, bullish price action) for the price to continue its push up to at least 0.7436 resistance (major swing high resistance, Fibonacci extension).

RSI (55) major support remains at 50% and only a clean break of that level would be a precursor that a drop is coming.

Buy above 0.7312. Stop loss at 0.7256. Take profit at 0.7436.

analytics5a71248a43e81.png


*The market analysis posted here is meant to increase your awareness, but not to give instructions to make a trade.
 
Technical analysis of EUR/USD for Feb 06, 2018

When the European market opens, some Economic Data will be released such as Retail PMI, French Gov Budget Balance, and German Factory Orders m/m. The US will release the Economic Data too, such as IBD/TIPP Economic Optimism, JOLTS Job Openings, and Trade Balance, so, amid the reports, EUR/USD will move in a low to medium volatility during this day.

TODAY'S TECHNICAL LEVEL:
Breakout BUY Level: 1.2444.
Strong Resistance:1.2437.
Original Resistance: 1.2425.
Inner Sell Area: 1.2413.
Target Inner Area: 1.2384.
Inner Buy Area: 1.2355.
Original Support: 1.2343.
Strong Support: 1.2331.
Breakout SELL Level: 1.2324.

Analysis are provided by InstaForex
 
Euro and Pound Test Key Support

Eurozone
The euro makes weak attempts to stay above 1.22, but success is possible only if the wave of panic in the stock and debt markets goes down, taking the form of correction, although deeper.
On Wednesday, the consumer inflation index will be published in Germany in January. It is expected to show a decline from 1.6% to 1.4% relative to December, but according to the forecast, the HICP index should remain unchanged at 1.4%. Also on Wednesday, Eurostat will publish an estimate of the eurozone's GDP in the fourth quarter, and there are no reasons for concern either - the PMI Markit and ESI economic activity indicators calculated by the European Commission are growing at a record pace, which, given the high correlation between PMI and GDP, which makes it possible to look at economic growth with optimism.

The problem for the eurozone is something different - the growing surplus of foreign trade leads to the need to seek the use of surplus capital. At the same time, the growth of inflation in the eurozone is not sufficient to force the ECB to begin the unwinding of its monetary policy. The spread between the yields of European and American securities is growing, and the capital from the eurozone will be in demand by investors in the US if rates in US banks continue to grow, especially since the threat of four rate hikes in the current year suddenly became real.

Monetary authorities of the eurozone will not prevent the outflow of excess capital, since this process will allow the euro to be controlled, but if the panic in the markets continues and it comes to a serious crisis, the euro may significantly weaken. Correction of the EUR USD pair is not yet completed, it is possible to decrease to 1.21, but the chances to stay above this support are still high. On Monday, the euro could return to zone 1.2305 / 20, further dynamics will be determined by whether a wave of panic that has covered the markets will develop.

United Kingdom
The pound last week has undergone multidirectional pressure. On Wednesday, the Bank of England supported the pound, leaving the rate unchanged and at the same time hinting that it could accelerate the process of raising rates due to higher economic growth rates.

Updated forecasts suggest GDP growth in 2018 at 1.8%, which, however, is below the growth rates in the US and the euro area, the equilibrium unemployment rate is reduced from 4.5% to 4.25%, and inflation by 2020 will be 2.2%, which is higher than the target 2%, which means an increase in the rate is required.

At the same time, as can be seen from the report, the growth of inflation occurred due to other goods, that is, most likely due to imports. The strengthening of the pound eliminates this factor in the coming months.

However, on Friday, the pound's declined resumed after the EU negotiator Michel Barnier stated that the Brexit agreement might not be reached. It is obvious that Brexit still remains the main factor of influence on the pound rate.

On Tuesday, data for January on retail sales and consumer inflation will be published. The forecasts are neutral and meet the expectations of the Bank of England. Determining the dynamics of the pound will continue to be based statements on Brexit, as well as the development of the situation with sales in the stock and debt markets. At the level of 1.3700/30 is the key support level, the pound has a chance to stay higher, the breakdown will worsen the technical picture and will contribute to a rapid decline on the background of flight from risk.

Oil
The weakening of oil looks like a rout, which is expected, based on the development of the situation in the markets. Oil reacts to the threat of slowing the growth of global GDP and the development of a full-scale crisis, and this is the main driver of decline.

Another factor contributing to the decline is the production growth in the US. In addition, Baker Hughes reported a sharp increase in the number of drilling last week by 29 pcs, which indicates an increase in investment in the industry.

Support for Brent resisted until 60.98, the channel is still up, so growth attempts after the formation of the bottom are not ruled out.

Analysis are provided by InstaForex
 
Daily analysis of EUR/JPY for March 5, 2018

EUR/JPY This cross pair is a weak market. It is interesting to see the market is engaged in a long, protracted bearish movement. Since the beginning of February, at least, 700 pups have been shed. In the past few weeks, short-term rallies have been invariably followed by further southwards movements.

3.png


There is currently a Bearish Confirmation Pattern in the market. The price would continue moving downwards towards the demand zones at 130.00, 129.50 and 129.00. Nonetheless, a strong rally is in the offing, as the outlook on EUR pairs is bullish for this week.

*The market analysis posted here is meant to increase your awareness, but not to give instructions to make a trade.
 
NZD/USD Intraday technical levels and trading recommendations for for March 20, 2018

analytics5ab0b4bb007d3.png


Daily Outlook

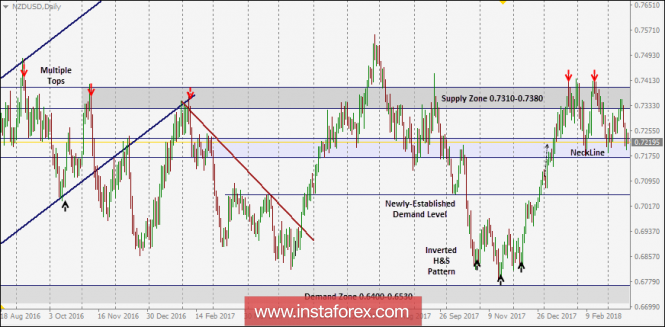
In July 2017, an atypical Head and Shoulders pattern was expressed on the depicted chart which indicated upcoming bearish reversal.
As expected, the price level of 0.7050 failed to offer enough bullish support for the NZD/USD pair. That's why, further bearish decline was expected towards 0.6800 (Reversal pattern bearish target).
Evident signs of bullish recovery was expressed around the depicted low (0.6780). An inverted Head and Shoulders pattern was expressed around these price levels.
The price zone of 0.7140-0.7250 (prominent Supply-Zone) failed to pause the ongoing bullish momentum. Instead, a bullish breakout above 0.7250 was expressed on January 11.
That's why, a quick bullish movement was expected towards the depicted supply zone (0.7320-0.7390) where evident bearish rejection and a valid SELL entry were expected.
On February 2, a bearish engulfing daily candlestick was expressed off the price level of 0.7390. Moreover, a double-top reversal pattern was expressed around the price zone (0.7320-0.7390).
The price zone (0.7320-0.7390) stood as a significant supply zone for the NZD/USD pair. Any bullish pullback towards this price zone should be considered for a valid SELL entry.
On the other hand, bearish breakdown of 0.7300 (neckline) is needed to confirm the depicted reversal pattern. Bearish projection target would be located around 0.7050 and 0.7000.

*The market analysis posted here is meant to increase your awareness, but not to give instructions to make a trade.
 
EUR/JPY analysis for March 21, 2018

analytics5ab2265520a5a.png


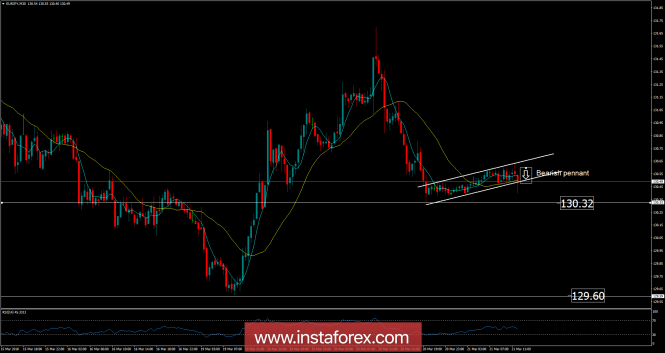
Recently, the EUR/JPY pair has been trading sideways at the price of 130.48. According to the 30M time frame, I found that price has broken the upward channel (bearish pennant) in the background, which is a sign that buying looks risky. I also found a strong downward leg in the background, which is another sign of weakness. My advice is to watch for potential selling opportunities. Downward targets are set at the price of 130.32 and at the price of 129.60.

Resistance levels:
R1: 131.30
R2: 132.20
R3: 132.65
Support levels:
S1: 129.93
S2: 129.44
S3: 128.53

Trading recommendations for today: watch for potential selling opportunities.

*The market analysis posted here is meant to increase your awareness, but not to give instructions to make a trade.
 
Technical analysis: Intraday level for USD/JPY, March 28, 2018

analytics5abb055fcf246.jpg


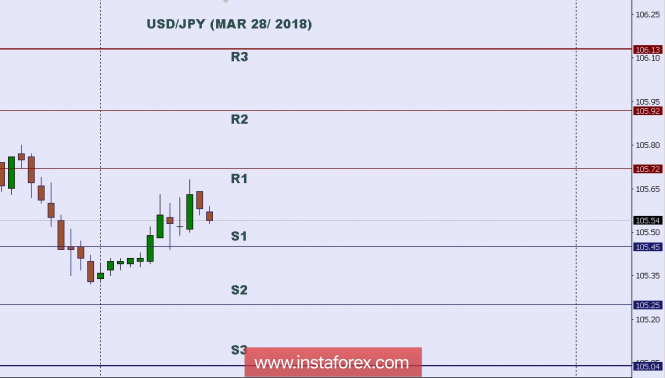
Today Japan will not release any Economic Data, but the US will release some Economic Data such as Crude Oil Inventories, Pending Home Sales m/m, Prelim Wholesale Inventories m/m, Goods Trade Balance, Final GDP Price Index q/q, and Final GDP q/q. So, there is a probability the USD/JPY will move with a low to medium volatility during this day.

TODAY'S TECHNICAL LEVEL:

Resistance. 3: 106.13.
Resistance. 2: 105.92.
Resistance. 1: 105.72.
Support. 1: 105.45.
Support. 2: 105.25.
Support. 3: 105.04.

Disclaimer: Trading Forex (foreign exchange) on margin carries a high level of risk, and may not be suitable for all Traders or Investors. The high degree of leverage can work against you as well as for you. Before deciding to invest in foreign exchange you should carefully consider your investment objectives, level of experience, and risk appetite. The possibility exists that you could sustain a loss of some or all of your initial investment and therefore you should not invest money that you cannot afford to lose. You should be aware of all the risks associated with foreign exchange trading, and seek advice from an independent financial advisor if you have any doubts.

*The market analysis posted here is meant to increase your awareness, but not to give instructions to make a trade.
 
Back
Top