Wave Analysis from InstaForex

The trade war holds the

The Australian dollar was marked by an impressive spurt due to an increase in global appetite for risk after the release of data on the US labor market, the release of strong statistics on retail sales and optimistic forecasts of the OECD. The authoritative organization believes that the Reserve Bank of Australia will begin to raise the main interest rate at the end of 2018 against the background of acceleration of average wages and inflation. GDP will grow by 2.9% this year and by 3% next year, unemployment will decrease to 5.4% in 2018 and to 5.3% in 2019. OECD believes that the main reasons for strong economic growth in Australia will be favorable the conjuncture of the commodity market and strong external demand.

The optimism of the Organization of Economic Cooperation and Development is not shared by the futures market, which, on the contrary, has shifted the expectations of the first increase in the cash rate since 2016 from the current 1.5% to the second half of 2019. Along with unfavorable internal factors in the form of sluggish labor and inflation, leaving much to be desired (unlike the main developed countries, unemployment in Australia is far from full employment (5%), investors are apprehensive about the trade wars, the rise in the cost of borrowing in the United States and the Italian political crisis. The shift in the timing of the start of the normalization of the monetary policy of RBA, along with the worsening global appetite for risk, put pressure on the Australian dollar.

Dynamics of MSCI EM and the probability of increasing the cash rate

One of the main problems of the "Aussie" is connected with the growth of the yield of US treasury bonds against the background of expectations of raising the Federal Reserve rate on federal funds to 2.5% within 12 months. This circumstance, coupled with the unwillingness of the RBA to change anything in the field of monetary policy, allows Morgan Stanley to recommend its clients to sell the AUD/USD. The yield differential between the 10-year Australian and American bonds is -15 bp, with an average value of the indicator for the last five years at +68 bpts. Such a situation on the debt market deprives the "Aussie" of support from carry traders who prefer to invest in assets of developing countries.

Additional pressure on the "Aussie" poses the risks of a trade war. The US is going to pause it, then revive the idea of import duties on steel and aluminum due to the intractability of its trading partners from Canada, Mexico and the EU, they openly shout about military actions. Donald Trump on his Twitter account said if you one $800 billion annually, there is no point in fearing a trade war. Under US pressure, China could reduce purchases of goods and services from Australia, which will negatively affect its economy. However, short-term strong statistics on retail sales, GDP and moderate optimism of the RBA may contribute to the correction of AUD/USD.

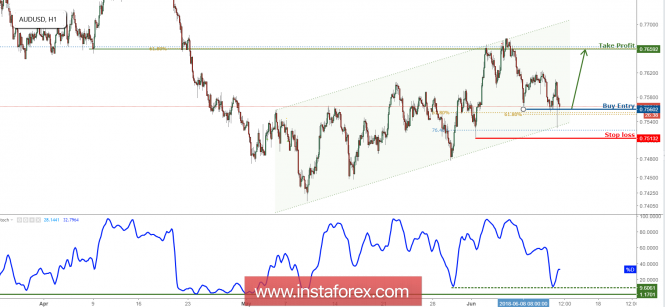
Technically, the return of the pair's quotations to the boundaries of the long-term upward trading channel will increase the risks of implementing the Bat pattern with a target of 88.6%.

AUD/USD, daily chart

*The market analysis posted here is meant to increase your awareness, but not to give instructions to make a trade.

Analysis are provided by InstaForex
 
Gold monitors the Fed

Having closed in the red zone for two months in a row, gold begins to rise from the ashes amid increasing rumors that the 6-week US dollar rally has come to an end. The escalation of trade tensions with China, Mexico, and Canada on the part of Washington testifies to the interest of the US administration in the weakness of its own currency. It was such speculation in the market during the height of the trade wars in the 1990s and 2000s that lowered the USD index by 20% and 12%. According to TD Securities, already in the fourth quarter of the precious metal will exceed the mark of $ 1400 per ounce, which was last seen in 2013. The company forecasts an average price of $ 1375 in October-December.

Dynamics of gold and dollar

The gradual decline in political risks in Italy after the announcement of the new Prime Minister Giuseppe Conte that the issue of the republic's exit from the eurozone is not on the agenda, as well as rumors about China's readiness to increase US imports of agricultural and energy goods by $ 70 billion in response to the abolition of tariffs The US reduced the demand for safe haven assets. Does not find gold support and in the physical asset market. According to authoritative sources Bloomberg, who wished to remain anonymous, purchases of precious metals by India in May fell to 77.6 tons (-39% m / m). According to the results of the third month of the spring of 2017, imports amounted to 126.2 tons. In January-May of this year, the figure fell to 289.3 tons (-42% y / y). One of the reasons is the weakness of the rupee, which has depreciated by 5% against the US dollar since early 2018. Dynamics of gold in rupees and dollars

However, if during the rest of the year the world economy synchronizes its growth, including thanks to the restoration of GDP in the eurozone, then the forces of dollar "bulls" will begin to melt before our eyes, which will support both rupee and Indian imports. An indicative example is the second half of 2017, when talks about the normalization of monetary policy by central banks-competitors of the Federal Reserve made from the American currency an outsider G10.

It is possible that the gold could rush up after the euro got rid of political chains already now, however, the offensive movement of the bulls on XAU / USD is holding back the FOMC meeting scheduled for June 13. The futures market gives a 94% probability of raising the federal funds rate to 2%, and precious metals traditionally fall before the historic meetings of the Fed, so that after them, take off thanks to the implementation of the "sell on the rumor, buy on facts" principle. Judging by the actual for 2016-2017 templates, it makes sense to form long positions on gold immediately after the announcement of the verdict of the Federal Reserve.

Technically, the "bulls" leave no attempts to withdraw quotes from the descending channel, take the resistance by $ 1302 per ounce and activate the "Crab" pattern. If they succeed, the chances of achieving a target of 161.8% will increase. It corresponds to $ 1,350. On the contrary, a successful support test at $ 1,288 will open the way for the "bears" to the south as part of the "Expanding Wedge" pattern. Gold, daily chart

*The market analysis posted here is meant to increase your awareness, but not to give instructions to make a trade.

Analysis are provided by InstaForex
 
EUR/CHF Bounced Off Support, Prepare For Further Rise

EUR/CHF bounced off its support at 1.1581 (61.8% Fibonacci extension, 61.8% & 38.2% & 23.6% Fibonacci retracement, horizontal overlap support) where we expect prices to rise to its resistance at 1.1658 (61.8% Fibonacci extension, horizontal swing high resistance).

Stochastic (55, 5, 3) bounced off its intermediate support at 10% where a corresponding rise is expected.

Buy above 1.1581. Stop loss at 1.1534. Take profit at 1.1658.

*The market analysis posted here is meant to increase your awareness, but not to give instructions to make a trade.

Analysis are provided by InstaForex
 
AUD/USD Approaching Support, Prepare For A Bounce!

AUD/USD is approaching its support at 0.7560 (61.8% Fibonacci extension, 61.8% Fibonacci retracement, horizontal swing low support) where we expect to see a bounce, causing the price to rise to its resistance at 0.7659 (61.8% & 50% Fibonacci retracement, horizontal overlap resistance).

Stochastic (89, 5, 3) is approaching its support at 9.6% where a corresponding bounce is expected.

Buy above 0.7560. Stop loss 0.7513. Take profit at 0.7659.

analytics5b21eab5b42d0.png


*The market analysis posted here is meant to increase your awareness, but not to give instructions to make a trade.
 
Trading Plan for Crude Oil for June 26, 2018

Technical outlook:
A medium-term time frame has been presented (4 hours) here, and the most probable wave counts have been labelled here. It looks to be like a bearish resumption trade setup is getting ready in Crude Oil now. Let us understand the wave counts from sub 73.00 levels. The drop from 73.00 to almost 63.50 has been an impulse (unfolding into 5 waves) as labeled here. The entire drop can be labeled as wave (1). The subsequent rally then unfolded into a probable Zigzag (5-3-5) corrective wave structure, labeled as a-b-c here. Also note that the termination of the wave (2) is just at Fibonacci 0.618 resistance, around 69.50 levels, which triggered a sharp reversal yesterday. if this ave structure holds to be good, we should witness a continued drop lower towards 58.00 and 48.00 respectively. Ideally, prices should now stay below 73.00 levels going forward.

Trading plan:
Remain short now, stop above 73.00, target 58.00 at least.

Fundamental outlook:
Watch out for US Consumer confidence numbers to be out today at 10:00 AM EST.

Analysis are provided by InstaForex
 
Technical analysis of USD/CHF for June 29, 2018

analytics5b35d1567fa48.png


The USD/CHF pair faced resistance at the level of 0.9943. The strong resistance has been already formed at the level of 0.9943 and the pair is likely to try to approach it in order to test it again. However, if the pair fails to pass through the level of 0.9943, the market will indicate a bearish opportunity below the new strong resistance level of 0.9943 (the level of 0.9943 coincides with a ratio of 78.6% Fibonacci). Moreover, the RSI starts signaling a downward trend, as the trend is still showing strength above the moving average (100) and (50). Thus, the market is indicating a bearish opportunity below 0.9943, so it would be good to sell at 0.9940 with the first target of 0.9795. It will also call for a downtrend in order to continue towards 0.9733. The daily strong support is seen at 0.9733. On the other hand, the stop loss order should always be taken into account, for that it will be reasonable to set your stop loss at the level of 1.0055 (the double top on the H4 chart).


*The market analysis posted here is meant to increase your awareness, but not to give instructions to make a trade.
 
Technical analysis of Gold for July 03, 2018

analytics5b3af7032629c.jpg


From the Daily Charts we know the Gold bias is still in a Bullish Condition, this can be seen by the Gold still moving in an up Channel event. Now Gold has a correction and tries to test the nearest Support level at 1,235.72 but it seems that in a few days Gold will be back to its previous bias (Bull). This is already confirmed by the Stochastic Oscilator now at the Oversold level and preparr to go up above the 20 level, so the next few days ahead it seems the Gold will go back to the previous bias (Bull). (Dsiclaimer)

*The market analysis posted here is meant to increase your awareness, but not to give instructions to make a trade.
 
Technical analysis: Intraday Level For EUR/USD, July 09, 2018

When the European market opens, some Economic Data will be released such as Sentix Investor Confidence, and German Trade Balance. The US will also release the Economic Data such as Consumer Credit m/m, so amid the reports, EUR/USD will move in a low to medium volatility during this day.

TODAY'S TECHNICAL LEVEL:
Breakout BUY Level: 1.1808.
Strong Resistance:1.1801.
Original Resistance: 1.1790.
Inner Sell Area: 1.1779.
Target Inner Area: 1.1751.
Inner Buy Area: 1.1723.
Original Support: 1.1712.
Strong Support: 1.1701.
Breakout SELL Level: 1.1694.

Analysis are provided by InstaForex
 
Brent disobeyed the president

Interruptions in supplies in Libya, Venezuela, Canada and Norway, Iran's threats to block the Strait of Hormuz, and some weakness of the US dollar after the release of the US labor market report for June allowed the bulls for Brent and WTI to continue the rally. If oil can update the May highs, the road in the direction of $ 83-85 per barrel will be opened. According to Tehran, the aim of restraining the price of black gold tweets of Donald Trump, in fact, can bring the North Sea grade to the psychologically important mark of $ 100 per barrel. Who is bigger? Sanford C. Bernstein & Co draws attention to the reduction in oil companies' stocks by an average of 30% since the beginning of 2000 and the increase in urban population in Asia by 1 billion over the next two decades. As a result, the demand for cars and gasoline will rise sharply, which will launch a new super cycle on black gold and allow it to grow to $ 150 per barrel.

The US president demands from his military allies (primarily from Saudi Arabia) to increase production to 2 million bpd, knowing full well that the OPEC decisions on the curtailment of the production of "bulls" for Brent and WTI at the end of June cannot be stopped. The states are exerting pressure on buyers of Iranian oil, and if their plan to reduce exports from this Middle Eastern country translates into life, then the market will take 2.5 million bpd. Tehran is the fifth oil producer in the world with a production volume of 3.8 million bpd. The country's leadership claims that it is ready to sell as much black gold as it can.

The support of Brent and WTI is provided by the factor of production reduction in Libya from 1.28 million bpd in February to the current 527 thousand bpd. According to Capital Economics estimates, the market may lose about 2 million bpd from Iran and 1 million bpd from Venezuela, which will widen the deficit and help develop the "bullish" conjuncture of the black gold market.

At first glance, instead of putting pressure on OPEC, Donald Trump could spur the activity of American producers. For a long time, the oil market was living in tug-of-war conditions between those working on reducing the cartel's output and companies from the States that used price increases to hike their own production and simultaneously hedge the risks. They let the number of drilling rigs from Baker Hughes grow (+5 to 863 in the week of July 6), and the Energy Information Administration forecasts an increase in production to a record 11.8 million bpd, no problems with the infrastructure have been canceled. For example, in the Perm basin in 2019 will produce 1 million bpd more than its pipes can afford to pump.

Extraction and power of pipelines

The hand to help the "bulls" for Brent and WTI is fixing profit to the US dollar after the publication of disappointing statistics on US unemployment and the average wage. The first indicator increased from 3.8% to 4%, the second did not reach the forecasts of experts from Bloomberg (+ 0.2% vs. + 0.3% m / m)

Technically, a breakthrough of resistance at $ 79.5 and $ 80.5 per barrel will open the "bulls" along Brent road to the north in the direction of the target for 127.2% and 161.8% for the AB = CD pattern.

Brent, daily chart

Analysis are provided by InstaForex
 
Elliott wave analysis of EUR/NZD for July 24, 2018

We continue to look for more upside pressure through resistance at 1.7268 and more importantly through resistance at 1.7305, that calls for red wave iii towards 1.7505 on the way higher towards 1.8381.

Support is now seen at 1.7206 and again at 1.7170. Ideally the later will be able to protect the downside for the expected break above 1.7268.

R3: 1.7305
R2: 1.7268
R1: 1.7232
Pivot: 1.7208
S1: 1.7184
S2: 1.7164
S3: 1.7144

Trading recommendation:
We are long EUR at 1.7226 with our stop placed at 1.7110. If you are not long EUR yet, then buy EUR upon a break above 1.7268 and start by using the same stop at 1.7110.

*The market analysis posted here is meant to increase your awareness, but not to give instructions to make a trade.

Analysis are provided by InstaForex
 
Elliott wave analysis of EUR/NZD for July 26, 2018

The ongoing correction in red wave ii keeps pushing lower, but it must not break below the start of red wave i at 1.7116 as a break below here, will confirm that black wave ii still is in motion and is headed for support at 1.7066. If, however, the low of red wave i at 1.7116 stays untouched, as we expected, for a break above the channel resistance near 1.7199, that will call for red wave iii towards 1.7510 on the way towards the first long-term target at 1.8381.
R3: 1.7305
R2: 1.7268
R1: 1.7199
Pivot: 1.7184
S1: 1.7165
S2: 1.7130
S3: 1.7116

Trading recommendation: We are long EUR from 1.7226 with our stop placed at 1.7110. If you are not long EUR yet, then buy a break above the channel-resistance at 1.7199 and use the same stop at 1.7110.

Analysis are provided by InstaForex
 
Elliott wave analysis of EUR/NZD for July 27, 2018

EUR/NZD is a break above the descending channel resistance-line near 1.7173 indicating that red wave ii completed with the test of 1.7130 and red wave iii towards 1.7510 now is developing.

Short-term, we would like to see a break above resistance at 1.7207 too, as confirmation that red wave iii is in motion for the next impulsive rally.

Support is now seen at 1.7162 and again at 1.7130. Ideally the later will be able to protect the downside for the expected break above 1.7207.

R3: 1.7305
R2: 1.7268
R1: 1.7207
Pivot: 1.7184
S1: 1.7162 S2: 1.7130
S3: 1.7116

Trading recommendation:
We are long EUR from 1.7226 with our stop placed at 1.7110. If you are not long EUR yet, you should buy here at 1.7180 or upon a break above 1.7207 and use the same stop at 1.7110.

Analysis are provided by InstaForex
 
Elliott wave analysis of EUR/NZD for July 30, 2018

We continue to expect support at 1.1716 will be able to protect the downside for a break above resistance at 1.7207 that confirms, that red wave ii has completed and that red wave iii towards 1.7510 and above is developing.

An unexpected break below support at 1.7116 will tell us that the correction in black wave ii/ still is in motion for a continuation closer to 1.7067 before a possible corrective low should be in place.

R3: 1.7268
R2: 1.7207
R1: 1.7163
Pivot: 1.7137
S1: 1.7116
S2: 1.7067
S3: 1.7033

Trading recommendation:
We are long EUR from 1.7226, with our stop placed at 1.7110. If you are not long EUR, the buy a break above 1.7207 and use the same stop at 1.7110.

Analysis are provided by InstaForex
 
Technical analysis: Intraday Level For EUR/USD, July 31, 2018

When the European market opens, some Economic Data will be released such as Unemployment Rate, Italian Prelim CPI m/m, Prelim Flash GDP q/q, Core CPI Flash Estimate y/y, CPI Flash Estimate y/y, Italian Monthly Unemployment Rate, German Unemployment Change, Spanish Flash GDP q/q, French Prelim CPI m/m, and German Retail Sales m/m. The US will release the Economic Data too such as CB Consumer Confidence, Chicago PMI, S&P/CS Composite-20 HPI y/y, Personal Income m/m, Personal Spending m/m, Employment Cost Index q/q, and Core PCE Price Index m/m, so amid the reports, EUR/USD will move in a medium volatility during this day.

TODAY'S TECHNICAL LEVEL:
Breakout BUY Level: 1.1765.
Strong Resistance:1.1758.
Original Resistance: 1.1757.
Inner Sell Area: 1.1736.
Target Inner Area: 1.1708. Inner
Buy Area: 1.1680.
Original Support: 1.1669.
Strong Support: 1.1658.
Breakout SELL Level: 1.1651.

Analysis are provided by InstaForex
 
Elliott wave analysis of EUR/NZD for August 1, 2018

EUR/NZD tried to break above short-term important resistance at 1.7205 but failed. We think it is just a matter of time before a new attempt to break above this resistance is seen. A firm break above resistance at 1.7205, will confirm that red wave ii has completed and that red wave iii towards 1.7510 and above is developing.

Short-term, support remains seen at 1.7134 and 1.7116. The later should continue to protect the downside for the expected break above 1.7205. An unexpected break below 1.7116, will indicate that black wave ii/ still is in motion for a spike lower to 1.7066 before turning higher in black wave iii/.

R3: 1.7268
R2: 1.7207
R1: 1.7185
Pivot: 1.7165
S1: 1.7137
S2: 1.7116
S3: 1.7106

Trading recommendation:
We are long EUR from 1.7226 with our stop placed at 1.7110. If you are not long EUR yet, then buy a break above 1.7205 and use the same stop at 1.7110.

Analysis are provided by InstaForex
 
Gold bets on August

July was the fourth consecutive month of gold closing in the red zone. The precious metal has not faced such a protracted peak since 2013. The US economy and the aggressive monetary tightening of the Fed, which gained under the influence of the fiscal stimulus, dealt a serious blow to the positions of the bulls in the XAU/USD. The futures market is almost 70% confident that the Federal reserve will raise rates twice before the end of the year amid a drop in unemployment to 4%, inflation to the target and an impressive +4.1% q/q of GDP for the second quarter.

Quarterly dynamics of gold

While Japanese investors kept the yield of 10-year US Treasury bonds below the psychologically important 3% mark, and the growth of US stock indices did not allow precious metals to play a role in escalating trade conflicts, a strong dollar left it no chance. Even the information from competent Reuters sources about Donald Trump's willingness to announce the expansion of import duties for China by $200 billion was perceived as a reason for selling the XAU/USD in the near future. The dollar, for investors, seems to be a more reliable safe-haven asset than gold.

What can the precious metal answer? First, the seasonal factor can play on its side. August is the second best month for gold after January. By the end of the last month of summer 2017, it has strengthened by more than 4%, and in 2016-2017, ETF reserves added about 4%. Second, speculative net longs have fallen to a record low since the date of the accounting in 2006. They are lower than at the end of 2015, when the Fed started the process of monetary policy normalization. Finally, third, the market has serious doubts about the ability of the US economy to maintain the pace taken in the second quarter. Let Donald Trump in this no doubt, but the logic says the opposite. The gradual fading of the effect of tax reform, tightening of the Fed's monetary policy, trade wars and the dollar's revaluation in April-July increase the risks of a slowdown in GDP in the third-fourth quarters.

Another thing is that the main competitor of the dollar in the face of the single European currency is not shining yet. In April-June, the divergence in economic growth of the US and the eurozone turned out to be the broadest one since 2014. This does not allow us to count on the ECB's departure from ultra-soft monetary policy and creates serious obstacles for the EUR/USD to move upwards.

In the short term, gold is likely to show increased sensitivity to the results of the FOMC meeting and the release of data on the US labor market. The Fed's "dovish rhetoric and sluggish wage growth will push futures prices in the direction of $1,250 per ounce. On the contrary, if the central bank prefers the "hawkish" hunt, and the statistics on wages will please the eye, the precious metal risks to continue the peak in the direction of $1200.

Technically, gold is trying to push off the convergence zone of $1207-1222 (targets for 200% and 88.6% by the AB=CD and "Shark" patterns). If the bulls manage to keep the quotes above the important support, the risks of a rollback to $1,243 and $1,272 will increase.

Gold, daily chart


Analysis are provided by InstaForex
 
Elliott wave analysis of EUR/JPY for August 6, 2018

EUR/JPY has moved just below the lower boundary at 128.66 (the low has been seen at 158.49). This does fulfill all requirements for our slightly preferred scenario, meaning that a low should be in place for wave ii/ and a new impulsive rally in wave iii/ should be ready to develop. Wave iii/ will ideally make it to 135.74 and possibly even higher.

That said, we need to remember that prices need to prove themselves for a strong rally above 129.62. The possible alternate scenario still remains possible. Under this count, wave ii still is developing as an expanded flat correction. If this count is correct, then we should expect resistance near 129.62 will cap the upside for a final decline towards 126.01 to complete wave ii before wave iii will be ready to take over.

R3: 129.62
R2: 129.18
R1: 129.00
Pivot: 128.77
S1: 128.50
S2: 128.11
S3: 127.69

Trading recommendation:
Our stop at 128.50 was hit for a 45 pips loss. We will re-buy EUR here at 128.72 and place our stop at 128.45.

Analysis are provided by InstaForex
 
Trump's trade policy continues to work

The euro continued to decline against the US dollar in the morning of Monday, August 6, amid the lack of important fundamental statistics, as well as expectations of further interest rate hikes in the United States.

Data on the sharp decline in orders in Germany put pressure on risky assets.

According to a report by the German Ministry of Economy, production orders in Germany declined sharply in June this year due to falling demand from countries outside the eurozone. This suggests that the current tensions in trade relations are already affecting the indicators, which will further exacerbate tensions between the US and the EU.

As indicated in the report, orders in the manufacturing sector in Germany in June 2018 fell by 4.0% compared to May, while economists had forecast a decline in orders by 0.5%. The ministry confirmed the fact that the uncertainty of the prospects of trade policy played a key role.

External orders in the German manufacturing sector in June fell by 4.7% compared to May, while domestic production orders decreased 2.8% compared to the previous month.

As I noted above, a particular decrease in orders was observed from countries that are not members of the eurozone. Here the figure fell by 5.9%. Compared to the same period of the previous year, orders in the German manufacturing sector decreased by 0.8%.

As for the technical picture of the EUR/USD pair, then, most likely, the pressure on the euro will continue. The breakthrough of support of 1.1530 will lead to new large sales in risky assets, with an exit to the lows of the month in the area of 1.1480 and 1.1440. The only hope of buyers in the short term is a return to the resistance of 1.1565, which will lead to an upward correction in the area of 1.16 and 1.1630.

The British pound continued to decline, ignoring the report on the volume of consumer lending in the UK, which in June this year has not changed compared to may. This shows that consumer spending will continue to grow in the future.

According to the Bank of England, in June 2018, net consumer lending to consumers in June amounted to 5.4 billion pounds against 5.3 billion pounds in May. Credit cards in June amounted to 1.6 billion pounds.

As for mortgage loans, the number was at the level of 65,619. As for the technical picture of the GBP/USD pair, the recovery prospects are also quite far. Brexit and uncertainty with a further increase in interest rates in the UK continue to weigh on the pound.

The current main goal of the sellers of the pound is the lows of 1.2890 and 1.2815. If we talk about the prospects for an upward correction, then, apparently, it will be limited in the area of resistances 1.2960 and 1.3000.

Analysis are provided by InstaForex
 
Elliott wave analysis of EUR/NZD for August 8, 2018

EUR/NZD is once again testing important resistance at 1.7224, but we need a clear break above here to confirm that the next impulsive rally towards 1.7510 is in motion. As long as resistance at 1.7224 is able to cap the upside as long does the possibility for a final drop into the 1.7033 - 1.7066 area exist, before completing wave ii/.

Longer-term, we remain bullish EUR/NZD for a rally towards 1.8310 and ultimately higher towards 1.98 - 1.99 area.

R3: 1.7305
R2: 1.7251
R1: 1.7224
Pivot: 1.7187
S1: 1.7150
S2: 1.7115
S2: 1.7094

Trading recommendation:
We are long EUR from 1.7226 with our stop placed at 1.7110.

Analysis are provided by InstaForex
 
Is the black band for gold over?

The leader of the precious metals sector, who marked its worst start in the last decade, managed to take a breather due to the strengthening of the Chinese yuan and the Japanese yen against the US dollar. The strong US currency has become the main culprit of the XAU/USD pair slumping by 7% since the beginning of the year. According to the World Gold Council report, global demand fell to 1959 tons in January-June, which is the lowest value since 2009. During the same period in 2017 it was about 2086 tons. And while interest in jewelry and the use of metal in the industry has been stable, the outflow of capital from the ETF became the main driver of falling prices.

According to WGC research, the reserves of specialized exchange-traded funds increased by a modest 60.9 tons in the first half of 2018. In January-June 2017, the process was significantly faster (+160.9 tons). The dog is buried in the flight of American investors from the market. Against the background of the dispersal of US GDP to 4.1% q/q, they preferred to buy securities rather than revenue-generating precious metals. The story of the collapse of Chinese stock indices under the influence of the slowdown of the Chinese economy and trade wars did not help either. If at the beginning of 2016 gold grew in response to the fall of Shanghai Composite, then this year assets prefer to go one way.

Dynamics of gold and the Shanghai Composite

If we focus on the dynamics of capital outflow from the ETF, we can assume that the XAU/USD will continue the downward campaign. Thus, according to Commerzbank's estimates, after the loss of stock of specialized exchange-traded funds of 29 tons in July, from the beginning of August they sank by another 16 tons. The bank expects that in the near future, under the influence of aggressive monetary tightening of the Fed, gold will test the psychologically important mark of $1200 per ounce. Supporters and speculators, who as of July 31 accumulated a record from 2006 net position on the analyzed asset in the futures market 27 156 contracts, equivalent to 2.7 million ounces.

Standard Bank, on the contrary, believes that the black band for the precious metal has remained in the past. The factor of four increases in the federal funds rate in 2018 is practically taken into account in the quotes of the USD index (the futures market gives about 70% of the probability of such an outcome), investors are unlikely to be surprised by this. But the slower normalization of monetary policy of the Fed or the loss of US GDP by the pair can lead to an increase in XAU/USD quotes to $1,260 per ounce in the third quarter. Before the end of the year, gold can test the level of $1300.

The pluralism of opinions allows the "bulls" of the precious metal to take a breath and contributes to its consolidation in the range of $1205-1235 per ounce. Investors will closely monitor the release of data on US inflation for July. Overclocking the CPU to 3% and above will increase the chances of four Fed rate increases and will contribute to the strengthening of the dollar.

Technically, gold reaching the convergence zone of $1185-1220 per ounce (targets for 88.6% and 113% on the "Double top" pattern) increases the risks of a rollback to the current short-term downward trend.

Gold, daily chart

Analysis are provided by InstaForex
 
Back
Top