Wave Analysis from InstaForex

USD/CAD intraday technical levels and trading recommendations for April 18, 2017

analytics58f5b725d3f6e.png


analytics58f5b74552c50.png


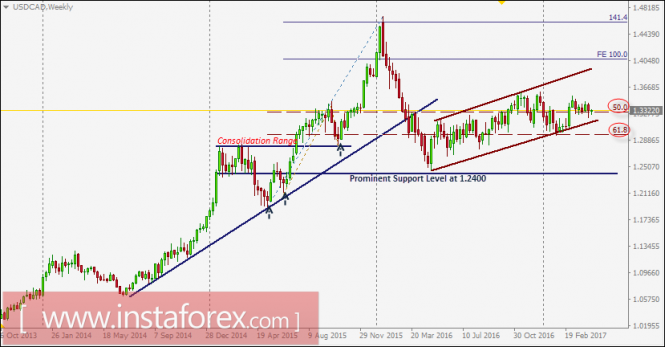
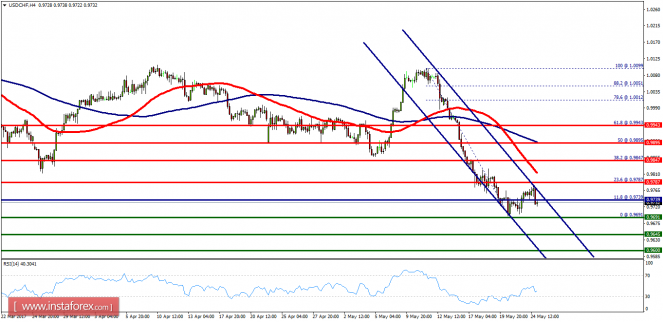
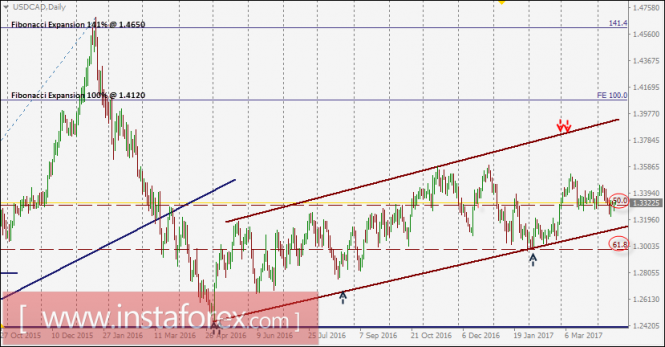
Since April 2016, the USD/CAD pair has been trending upward within the depicted ascending channel.

In December 2016, a bullish breakout above 1.3300 (50% Fibonacci level) was expected to allow a further advance toward 1.3700-1.3750 (the upper limit of the depicted channel).

However, significant bearish rejection was expressed around 1.3580 (recently established top).

During the bearish pullback, the price level of 1.3300 (50% Fibonacci Level) failed to provide enough support to the pair.

This allowed a further bearish movement toward the price level of 1.2970 (61.8% Fibonacci level) where a valid BUY entry was offered in February 2017.

Three weeks ago, the bullish breakout above 1.3300 (50% Fibonacci Level) enhanced a further advance toward 1.3440 and 1.3530.

The next bullish target would be located around 1.3800 (upper limit of the depicted channel) if the pair maintains upside trading above 1.3300 (50% Fibonacci Level) which stands as a prominent support level.

On the other hand, if the USD/CAD pair moves below 1.3300, it may become trapped again within the depicted consolidation range (1.3300-1.2970).


InstaForex analytical reviews will make you fully aware of market trends!
Being an InstaForex client, you are provided with a large number of free services for efficient trading.


More analysis - at instaforex.com
 
Elliott wave analysis of EUR/JPY for April 19, 2017

Wave summary: EUR/JPY has now spiked to resistance at 116.55 indicating that a low is in place at 114.82 and a new rally to above 124.09 should be expected. Short term, we should expect a minor set-back towards 115.70 before the next impulsive rally higher towards 118.25. Above here, it will confirm the low has been seen and confirm a rally back to 122.88 and 124.09 on the way higher.

R3: 117.47
R2: 116.85
R1: 116.61
Pivot: 116.40
S1: 116.24
S2: 115.94
S3: 115.72

Trading recommendation:
We are long EUR from 115.25 with stop placed at 114.75. If you are not long EUR yet, then buy near 115.72 and use the same stop at 114.75.

Analysis are provided by InstaForex
 
Technical analysis of EUR/USD for Apr 25, 2017

When the European market opens, some Economic Data will be released, such as Belgian NBB Business Climate. The US will release the Economic Data, too, such as Richmond Manufacturing Index, New Home Sales, CB Consumer Confidence, S&P/CS Composite-20 HPI y/y, and HPI m/m, so, amid the reports, EUR/USD will move in a low to medium volatility during this day.

TODAY'S TECHNICAL LEVEL:
Breakout BUY Level: 1.0918.
Strong Resistance:1.0912.
Original Resistance: 1.0901.
Inner Sell Area: 1.0890.
Target Inner Area: 1.0865.
Inner Buy Area: 1.0840.
Original Support: 1.0829.
Strong Support: 1.0818.
Breakout SELL Level: 1.0812.

Analysis are provided by InstaForex
 
Daily analysis of USDX for April 28, 2017

The index is now capped by the resistance level of 99.28, as the bulls are trying to gather enough bullish momentum to perform a breakout to the upside. However, a pullback might happen to re-test the support area of 98.83. The 200 SMA on H1 chart remains an active dynamic supply zone to cap further gains. MACD indicator is turning neutral, supporting a sideways tone for USDX in the coming days.

USDXH1.png


H1 chart's resistance levels: 99.28 / 99.97
H1 chart's support levels: 98.83 / 98.42

Trading recommendations for today:

Based on the H1 chart, place sell (short) orders only if the USD Index breaks with a bearish candlestick; the support level is at 98.83, take profit is at 98.42 and stop loss is at 99.24.


InstaForex analytical reviews will make you fully aware of market trends!
Being an InstaForex client, you are provided with a large number of free services for efficient trading.


More analysis - at instaforex.com
 
Technical analysis of USD/JPY for May 03, 2017

In Asia, today Japan will not release any economic data. However, the US will release a series of fundamental data such as Federal Funds Rate, FOMC Statement, Crude Oil Inventories, ISM Non-Manufacturing PMI, Final Services PMI, and ADP Non-Farm Employment Change. So there is a probability the USD/JPY pair will move with medium volatility during this day.

TODAY'S TECHNICAL LEVEL:
Resistance 3: 112.61.
Resistance 2: 112.39.
Resistance 1: 112.17.
Support 1: 111.90.
Support 2: 111.63.
Support 3: 111.46.

Analysis are provided by InstaForex
 
Technical analysis of USD/CHF for May 8, 2017

USDCHFM30.png


USD/CHF is under pressure as the key resistance is set at 0.9915. The pair stays below its resistance at 0.8490, and is capped by its 50-period moving average. Meanwhile, the 20-period moving average is still below the 50-period moving average, and the relative strength index is around its neutrality area at 50, lacking upward momentum.

The U.S. Labor Department reported that nonfarm payrolls increased by 211,000 in April, higher than +188,000 expected. The jobless rate edged down 0.1 percentage point to 4.4% (vs. 4.6% expected), its lowest level since May 2007.

As long as the key resistance at 0.9915 is not broken above, the risk of a break below 0.98660 remains high. A further down leg to 0.9840 and 0.9810 is also likely.

Resistance levels: 0.9930, 0.9950, and 0.9975

Support levels: 0.9860, 0.9840, and 0.9810

InstaForex analytical reviews will make you fully aware of market trends!
Being an InstaForex client, you are provided with a large number of free services for efficient trading.


More analysis - at instaforex.com
 
Technical analysis of NZD/USD for May 09, 2017

NZDUSDH4.png


Overview:

The NZD/USD pair continues to move upwards from the level of 0.6847. Today, the first support level is currently seen at 0.6847, the price is moving in a bullish channel now. The level of 0.6847 coincides with the double bottom, which is expected to act as a minor support today. Besides, the double bottom is seen at the point of 0.6847. Since the trend is above the level of 0.6847, the market is still in an uptrend because the major support is seen at the level of 0.6847. Furthermore, the trend is still showing strength above the moving average (100). Thus, the market is indicating a bullish opportunity above the mentioned support levels, for that the bullish outlook remains the same as long as the 100 EMA is heading upwards. Therefore, strong support will be found at the level of 0.6847 providing a clear signal to buy with a target seen at 0.6998. If the trend breaks the first resistance at 0.6998, the pair will move upwards continuing the bullish trend development to the level 0.7053 in order to test the double top. Besides, it should be noted that the pivot is seen at 0.6922. However, the price spot of 0.6847 and 0.6871 remains a significant support zone. Thus, the trend is still bullish as long as the level of 0.6847 is not breached.

InstaForex analytical reviews will make you fully aware of market trends!
Being an InstaForex client, you are provided with a large number of free services for efficient trading.


More analysis - at instaforex.com
 
Ichimoku indicator analysis of Gold for May 10, 2017

Gold price continues to make lower lows and lower highs. Trend remains bearish. Gold has limited downside. I still prefer bullish positions at the current levels.

analytics5912c09a476a0.jpg


Blue lines - bearish channel

Despite being still inside the bearish channel and below both the tenkan- and kijun-sen, the RSI divergence signals that gold is just above previous lows at $1,194. I believe there are a lot of chances for a move higher at least towards the Kumo resistance at $1,250.

analytics5912c0ef4e638.jpg


Red line -long-term resistance trend line

Gold price remains inside the weekly cloud but above the weekly kijun-sen. Price has held above the lower Kumo boundary and this is a positive sign. If Gold manages to make a higher low relative to the $1,194 low in March, we could expect a strong upward reversal start from around current levels.


InstaForex analytical reviews will make you fully aware of market trends!
Being an InstaForex client, you are provided with a large number of free services for efficient trading.


More analysis - at instaforex.com
 
Technical analysis of USD/JPY for May 11, 2017

USDJPYM30.png


USD/JPY is expected to trade in a higher range. The pair validated an intraday triangle pattern, and resumed its uptrend. A bullish cross has been identified between the 20-period and 50-period moving averages, which should confirm a positive outlook. Besides, the relative strength index is bullish above its neutrality area at 50.

To conclude, as long as 113.95 holds on the downside, look for a continuation of the rebound to 114.40 and 114.70 in extension.

The pair is trading above its pivot point. It is likely to trade in a wider range as long as it remains above its pivot point. Therefore, long positions are recommended with the first target at 114.40 and the second one at 114.70. In the alternative scenario, short positions are recommended with the first target at 113.60 if the price moves below its pivot points. A break of this target may push the pair further downwards, and one may expect the second target at 113.40. The pivot point lies at 113.95.

Resistance levels: 114.35, 114.70, and 115.00

Support levels: 113.60, 113.10, and 112.65


InstaForex analytical reviews will make you fully aware of market trends!
Being an InstaForex client, you are provided with a large number of free services for efficient trading.


More analysis - at instaforex.com
 
GBP/USD above strong support, prepare to buy on dips

Price is above major support at 1.2861 (Fibonacci retracement, horizontal overlap support, Fibonacci extension) and we expect price to make a bounce above this level towards 1.2988 resistance

(Fibonacci extension, horizontal swing high resistance). Stochastic (34,5,3) is also seeing strong support above the 13% area where we expect further bullish action from.

Buy above 1.2861. Stop loss at 1.2798. Take profit at 1.2988.

Analysis are provided by InstaForex
 
Technical analysis of USD/CHF for May 18, 2017

USDCHFDaily.png


Overview:

The USD/CHF pair continues to move downwards from the level of 0.9893.

Today, the first resistance level is seen at 0.9893 followed by 0.9948 as second resistance.

Also, the level of 0.9787 represents a weekly pivot point for that it will act as major resistance/support in coming hours.

Amid the previous events, the pair is still in a downtrend, because it is trading in a bearish trend from the new resistance line of 0.9893 towards the first support level at 0.9787 in order to test it.

If the pair succeeds to pass through the level of 0.9787, the market will indicate a bearish opportunity below the levels of 0.9710 and 0.9655.

However, if a breakout happens at the resistance level of 0.9893 (resistance 1), then this scenario may be invalidated.

Additionally, the support is found at 0.9893, which represents the 50% Fibonacci retracement level on the daily time frame. Since the trend is below the 50% Fibonacci level, the market is still in an downtrend.


InstaForex analytical reviews will make you fully aware of market trends!
Being an InstaForex client, you are provided with a large number of free services for efficient trading.


More analysis - at instaforex.com
 
Ichimoku indicator analysis of Gold for May 19, 2017

Gold price as expected is pulling back from the important weekly resistance at $1,260. Bulls now we need to see a higher low relative to the May lows at $1,214. A corrective pullback that will not hurt the bullish scenario should hold above $1,234.

analytics591e8e370a36a.jpg


Gold price is trading above the 4-hour cloud. Trend is bullish. Gold price could bounce from current levels as price has found support at the 38% Fibonacci retracement of the rise from $1,214. Next important support is at $1,234 where the 61.8% and the cloud supports are found. Bulls should not lose that level. On the other hand bears stopped the rise right at the important resistance of $1,260. Now they need to break back below the cloud for the move towards $1,150-60 to start.

analytics591e8e9639e8a.jpg


Red line -long-term resistance

Gold remains inside the weekly Kumo (cloud). Weekly trend remains neutral. Price remains below the weekly trend line resistance. However the bounce off the lower cloud boundary was a bullish sign. Bulls however need to break above the weekly cloud at $1,280 for the bull trend to be confirmed.


InstaForex analytical reviews will make you fully aware of market trends!
Being an InstaForex client, you are provided with a large number of free services for efficient trading.


More analysis - at instaforex.com
 
Ichimoku indicator analysis of gold for May 22, 2017

Gold price is overbought in the short-term and justifies a pullback towards $1,240. It is important for Gold bulls to hold above $1,230 and create a new short-term base of a higher low in order to move above $1,280-$1,300 which is the long-term resistance.

analytics59228fa23190a.jpg


Gold price is trading above the Ichimoku cloud support. Price got rejected at the resistance of the 61.8% Fibonacci retracement. Short-term support is at $1,247 and next at $1,230. Price is expected to move lower before higher.

analytics5922902149af6.jpg


Gold daily chart shows price above daily cloud but below the 61.8% Fibo level resistance. I expect a pullback and a higher low to be created over this week. As long as price is above $1,213 we target $1,230-40 and next $1,280-$1,300. If the $1,213 low is broken, expect a move towards $1,150-60.


InstaForex analytical reviews will make you fully aware of market trends!
Being an InstaForex client, you are provided with a large number of free services for efficient trading.


More analysis - at instaforex.com
 
Technical analysis of USD/CHF for May 25, 2017

USDCHFH4.png


Overview:
The USD/CHF pair. The first resistance level is seen at 0.9787 followed by 0.9847, while daily support 1 is seen at 0.9691. The USD/CHF pair broke support which turned to strong resistance at 0.9787. The market is still set to trade around the daily pivot point of 0.9739. This week, it continued to move downwards from the level of 0.9787 to the bottom around 0.9739. The pair is trading below this level. It is likely to trade in a lower range as long as it remains below the resistance of 0.9787 which is expected to act as major resistance. Amid the previous events, the USD/CHF pair is still moving between the levels of 0.9787 and 0.9691. For that reason, the major resistance can be found at 0.9787 providing a clear signal to sell with a target seen at 0.9691. If the trend breaks the minor support at 0.9691, the pair will move downwards continuing the bearish trend development to the level of 0.9645 and 0.9600 in order to test the daily support 3. Overall, we still prefer the bearish scenario which suggests that the pair will stay below the area of 0.9787 (resistance).


InstaForex analytical reviews will make you fully aware of market trends!
Being an InstaForex client, you are provided with a large number of free services for efficient trading.


More analysis - at instaforex.com
 
Elliott wave analysis of EUR/JPY for May 26, 2017

analytics5927ab1d8121a.png


Wave summary:
We continue to look for a corrective decline into the 123.78 - 124.17 area before the next impulsive rally towards 134.30 and 138.52 should be expected. Short-term resistance is now seen at 125.16 and again at 125.43, Only a break above the later will indicate that the correction is complete and more upside towards 134.30 is developing.

R3: 125.81
R2: 125.43
R1: 125.16
Pivot: 125.00
S1: 124.86
S2: 124.17
S3: 123.78

Trading recommendation:

We will re-buy EUR at 124.20 or upon a break above 125.43.


InstaForex analytical reviews will make you fully aware of market trends!
Being an InstaForex client, you are provided with a large number of free services for efficient trading.


More analysis - at instaforex.com
 
Do you want to obtain Currency trading statistics publication to your email?
Subscribe online and get the everyday newest opinions made by expert experts of InstaForex Company.
 
The dollar remained without support

The US dollar finished the week with large-scale sales, never seeing a single factor that could support it. The formal reason for the decline in investor confidence was the report of the Bureau of Labor Statistics on inflation, but this was not the only reason.

Consumer prices remained unchanged in June while annual inflation slowed to 1.6% from 1.9% a month earlier. Both indicators were worse than expected.

Also an unpleasant surprise was the decline in retail sales for the second month in a row. Experts expected a slight increase. The slowdown in consumer activity is an alarming factor as it indicates that incoming signals, one after another, about slower economic growth are not accidental and will likely cause a crisis to develop.

The preliminary value of the consumer confidence index according to the University of Michigan was significantly lower than expected at 93.1 points in July against the forecast of 95.0 points and last month's figure of 95.1 points. The subindex of expectations are declining at the fastest rate, indicating that consumers are preparing for a deterioration in the outlook for the coming months.

The GDPNow model from the Federal Reserve Bank of Atlanta forecasts the US GDP growth for the second quarter at 2.4%. This is higher than the result of the first quarter but significantly below expectations. The first estimate, which was presented in May, came out at 4.3%. At the time, it seemed that the positive momentum in the economy will develop but for two months in a row, the key macroeconomic indicators are worse than forecasts.

The Federal Reserve Bank of New York expects that GDP growth will be at 1.9% in Q2. However, this estimate may be too optimistic. At any rate, Fed Chairman Janet Yellen, speaking in Congress, said that achieving an economic growth of 3% "will be pretty hard." Recalling the basic scenario by the Congressional Budget Office (CBO), the average annual growth is set at 4%. Even in this case, the budget deficit in the next ten years will grow to 1.5 trillion dollars and reach a GDP of 5.2%. Weaker growth will significantly accelerate the development of a negative scenario. It can only be overcome through swift and decisive reforms while the situation develops in the opposite way. As indicated in the report of the Ministry of Finance published on Thursday, the budget deficit in June amounted to 90.233 billion dollar within the nine months of the current fiscal year. The negative balance grew by 31% and reached 523 billion. There is no reason to expect that the situation may change as the collection of taxes is reduced. Against the background of a drop in consumer activity, there is no chance of an increase of tax collection.

Actually, it was the reassessment of the player's prospects for the development of the situation that caused the dollar to fall sharply on Friday. It's not just a matter of low inflation. The fact is that even optimistic models (and the optimistic CBO forecast) do not see good exit scenarios. The Fed may begin to reduce the balance sheets in the coming months. In any case, the preparation of public opinion for this step is being carried out purposefully. Yesterday, the head of the Federal Reserve Bank of Dallas, Robert Kaplan, said that it is necessary to start reducing the Fed's balance sheet "very soon", possibly in September. Low inflation, in his opinion, is temporary. He also added that the achievement of full employment will contribute to higher prices.

The beginning of the reduction in the balance of the Fed means terminating the practice of refinancing revenues. In other words, the Fed will gradually reduce the repayment of government debts which, against the background of a growing budget deficit and a reduction in the collection of taxes, can have extremely unpleasant consequences for the Trump administration. In September, the government should already receive a result regarding the level of borrowing from the Congress. This will exhaust the latest resources for financing current activities and will make them face the prospect of technical default. However, in order for the Congress to meet Trump and raise the ceiling of national debt, it will be necessary to convince him of the feasibility plans for reforming the tax and health policies. It is necessary to present these plans formally.

Thus, for the dollar, there is still no reason to resume growth.

Analysis are provided by InstaForex
 
NZD/USD Intraday technical levels and trading recommendations for July 24, 2017

analytics59758ba831b61.png


Daily Outlook

The NZD/USD pair has been trending up within the depicted bullish channel since January 2016.

In November 2016, early signs of bullish weakness were expressed on the chart when the pair failed to record a new high above 0.7400.

A bearish breakout of the lower limit of the channel took place in December 2016. In February 2017, the depicted short-term downtrend was initiated in the depicted supply zone (0.7310-0.7380).

However, a recent bullish breakout above the downtrend line took place in May 22. Since then, the market has been bullish as depicted on the chart.

The price zone of 0.7150-0.7230 (SUPPLY ZONE in confluence with 61.8% Fibonacci level) stood as a temporary resistance zone until a bullish breakout was expressed above 0.7230.

This resulted in a quick bullish advance towards the next supply zone around 0.7310-0.7380 which is being temporarily breached to the upside.

Now the price zone of 0.7310-0.7380 turns to be a newly-established demand-zone to be watched for possible bullish rejection if any bearish pullback occurs.

InstaForex analytical reviews will make you fully aware of market trends!
Being an InstaForex client, you are provided with a large number of free services for efficient trading.
 
AUD/USD prepare to sell on break of key support

The price is hovering above key support at 0.7871 (Fibonacci retracement, horizontal swing low support) and we prepare to sell once price breaks this key level. Our profit target is a push down to next key support level at 0.7741 (Fibonacci retracement, horizontal pullback support).

RSI (55) is seeing bearish momentum within its bearish descending channel.

Sell below 0.7871. Stop loss is at 0.7937. Take profit is at 0.7741.

analytics5976aaf645232.png


InstaForex analytical reviews will make you fully aware of market trends!
Being an InstaForex client, you are provided with a large number of free services for efficient trading.
 
USD/CHF profit target reached perfectly, prepare to sell

The price has shot up perfectly and reached our profit target from yesterday. We prepare to sell below major resistance at 0.9530 (Fibonacci retracement, Fibonacci extension, horizontal pullback resistance) for a push down to at least 0.9436 support (Fibonacci extension, horizontal swing low support).

Stochastic (55,5,3) is right on major resistance at 95%.

Sell below 0.9530. Stop loss is at 0.9563. Take profit is at 0.9436.

analytics5977f6a537527.png


InstaForex analytical reviews will make you fully aware of market trends!
Being an InstaForex client, you are provided with a large number of free services for efficient trading.
 
Back
Top