Wave Analysis from InstaForex

Technical analysis of GBP/JPY for March 21, 2017

GBP/JPY is expected to trade in the lower range. The pair remains capped by its descending 20-period moving average, which has again crossed below the 50-period moving average. Meanwhile, the relative strength index stays below its neutrality area at 50 and has broken down the 30 level. The intraday trend remains negative.

As long as 139.80 holds as the key resistance, expect a drop to the nearest support at 138.85 at first. A break below 138.85 allows for the further drop to 138.55 as likely.

The pair is trading below its pivot point. It is likely to trade in a lower range as long as it remains below the pivot point. Short positions are recommended with the first target at 138.85. A break below this target will move the pair further downwards to 138.55. The pivot point stands at 139.80. If the price moves in the opposite direction and bounces back from the support level, it will move above its pivot point. It is likely to move further to the upside. According to that scenario, long positions are recommended with the first target at 140.20 and the second one at 140.50.

Resistance levels: 140.20, 140.50, and 140.95
Support levels: 138.85,138.55, and 138.00

More analysis - at instaforex.com
 
Technical analysis of GBP/JPY for March 22, 2017

GBP/JPY is under pressure. The pair is still capped by its descending 20-period moving average, which has crossed below the 50-period moving average. Meanwhile, the relative strength index stays below its neutrality area at 50 and lacks upward momentum. The intraday trend remains negative.

As long as 139.85 holds as the key resistance, expect a drop to the nearest support at 138.85 at first. A break below 138.85 allows for the further drop to 138.55 as likely.

The pair is trading below its pivot point. It is likely to trade in a lower range as long as it remains below the pivot point. Short positions are recommended with the first target at 138.85. A break below this target will move the pair further downwards to 138.55. The pivot point stands at 139.80. If the price moves in the opposite direction and bounces back from the support level, it will move above its pivot point. It is likely to move further to the upside. According to that scenario, long positions are recommended with the first target at 140.20 and the second one at 140.50.

Resistance levels: 140.20, 140.50, and 140.95
Support levels: 138.85,138.55, and 138.00

More analysis - at instaforex.com
 
Technical analysis of EUR/USD for Mar 23, 2017

When the European market opens, some Economic Data will be released, such as Consumer Confidence, Belgian NBB Business Climate, ECB Economic Bulletin, and GfK German Consumer Climate. The US will release the Economic Data, too, such as Natural Gas Storage, New Home Sales, and Unemployment Claims, so, amid the reports, EUR/USD will move in a low to medium volatility during this day.

TODAY'S TECHNICAL LEVEL:
Breakout BUY Level: 1.0841.
Strong Resistance:1.0835.
Original Resistance: 1.0824.
Inner Sell Area: 1.0813.
Target Inner Area: 1.0788.
Inner Buy Area: 1.0763.
Original Support: 1.0752.
Strong Support: 1.0741.
Breakout SELL Level: 1.0735.

More analysis - at instaforex.com
 
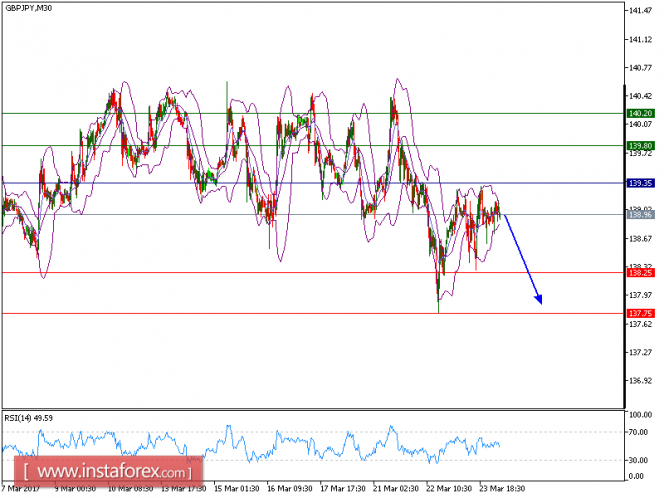
Technical analysis of GBP/JPY for March 24, 2017

GBPJPYM30.png


GBP/JPY is Under pressure. The pair has been capped by both descending 20-period and 50-period moving averages and remains on the downside. The technical configuration remains negative as the 20-period moving average is below the 50-period one, and the relative strength index is below its neutrality area at 50.

As long as 139.35 holds as the key resistance, expect a break below the nearest support at 138.25 at first. A break below 138.25 allows for the further drop to 137.75 as likely.

The pair is trading below its pivot point. It is likely to trade in a lower range as long as it remains below the pivot point. Short positions are recommended with the first target at 138.25. A break below this target will move the pair further downwards to 137.75. The pivot point stands at 139.35. If the price moves in the opposite direction and bounces back from the support level, it will move above its pivot point. It is likely to move further to the upside. According to that scenario, long positions are recommended with the first target at 139.80 and the second one at 140.20.

Resistance levels: 139.80, 140.20, and 140.50

Support levels: 138.25,137.75, and 137.00

InstaForex analytical reviews will make you fully aware of market trends!
Being an InstaForex client, you are provided with a large number of free services for efficient trading.


More analysis - at instaforex.com
 
Technical analysis of EUR/USD for Mar 27, 2017

When the European market opens, some Economic Data will be released, such as Private Loans y/y, M3 Money Supply y/y, and German Ifo Business Climate. Today, the US will not release any Economic Data, so, amid the reports, EUR/USD will move in a low to medium volatility during this day.

TODAY'S TECHNICAL LEVEL:
Breakout BUY Level: 1.0897.
Strong Resistance:1.0891.
Original Resistance: 1.0880.
Inner Sell Area: 1.0869.
Target Inner Area: 1.0844.
Inner Buy Area: 1.0819.
Original Support: 1.0808.
Strong Support: 1.0797.
Breakout SELL Level: 1.0791.

More analysis - at instaforex.com
 
NZD/USD intraday technical levels and trading recommendations for March 28, 2017

The NZD/USD pair was trapped within the depicted price range (0.6860-0.6990) until a bullish breakout occurred.

A bullish breakout above 0.6960-0.7000 allowed the pair to head toward the price level of 0.7100 (the key level) which failed to provide sufficient bearish pressure on the pair.

Bullish persistence above 0.7100 allowed further advance toward 0.7250-0.7350 (Sell-Zone) where the bearish price action was expected.

Bearish persistence below 0.7250 allowed further decline toward 0.7100 then 0.6960 which failed to provide enough support for the pair.

That is why further bearish fall was expected toward 0.6860 (the lower limit of the depicted BUY zone) where a bullish position was suggested in previous articles.

Recently, the bullish breakout above the depicted key level (0.6960) was achieved. That is why any bearish pullback toward 0.6960 should be watched for bullish rejection and a possible BUY entry.

On the other hand, the price level of 0.7100 remains a significant key level to be watched for bearish price action if the current bullish pullback persists above 0.7040.

More analysis - at instaforex.com
 
Technical analysis of EUR/USD for Mar 29, 2017

EURUSD.jpg


When the European market opens, some Economic Data will be released, such as German Import Prices m/m. The US will release the Economic Data, too, such as Crude Oil Inventories, Pending Home Sales m/m, so, amid the reports, EUR/USD will move in a low to medium volatility during this day.

TODAY'S TECHNICAL LEVEL:
Breakout BUY Level: 1.0869.
Strong Resistance:1.0863.
Original Resistance: 1.0852.
Inner Sell Area: 1.0841.
Target Inner Area: 1.0816.
Inner Buy Area: 1.0791.
Original Support: 1.0780.
Strong Support: 1.0769.
Breakout SELL Level: 1.0763.

More analysis - at instaforex.com
 
Technical analysis of USD/JPY for Mar 30, 2017

In Asia, Japan today will not release any Economic Data, but the US will release some Economic Data, such as Natural Gas Storage, Final GDP Price Index q/q, Unemployment Claims, and Final GDP q/q. So, there is a probability the USD/JPY will move with low to medium volatility during this day.

TODAY'S TECHNICAL LEVEL:
Resistance. 3: 111.94.
Resistance. 2: 111.72.
Resistance. 1: 111.50.
Support. 1: 111.24.
Support. 2: 111.02.
Support. 3: 110.80.

More analysis - at instaforex.com
 
Technical analysis of EUR/USD for Mar 31, 2017

When the European market opens, some Economic Data will be released, such as Italian Prelim CPI m/m, Core CPI Flash Estimate y/y, CPI Flash Estimate y/y, German Unemployment Change, French Prelim CPI m/m, French Consumer Spending m/m, and German Retail Sales m/m. The US will release the Economic Data, too, such as Revised UoM Inflation Expectations, Revised UoM Consumer Sentiment, Chicago PMI, Personal Income m/m, Personal Spending m/m, and Core PCE Price Index m/m, so, amid the reports, EUR/USD will move in a low to medium volatility during this day.

TODAY'S TECHNICAL LEVEL:
Breakout BUY Level: 1.0738.
Strong Resistance:1.0731.
Original Resistance: 1.0721.
Inner Sell Area: 1.0711.
Target Inner Area: 1.0686.
Inner Buy Area: 1.0661.
Original Support: 1.0651.
Strong Support: 1.0641.
Breakout SELL Level: 1.0634.

More analysis - at instaforex.com
 
Technical analysis of EUR/USD for Apr 03, 2017

When the European market opens, some Economic Data will be released, such as Unemployment Rate, PPI m/m, Italian Monthly Unemployment Rate, Final Manufacturing PMI, German Final Manufacturing PMI, French Final Manufacturing PMI, Italian Manufacturing PMI, and Spanish Manufacturing PMI. The US will release the Economic Data, too, such as Total Vehicle Sales, ISM Manufacturing Prices, Construction Spending m/m, ISM Manufacturing PMI, and Final Manufacturing PMI, so, amid the reports, EUR/USD will move in a low to medium volatility during this day.

TODAY'S TECHNICAL LEVEL:
Breakout BUY Level: 1.0720.
Strong Resistance:1.0713.
Original Resistance: 1.0703.
Inner Sell Area: 1.0693.
Target Inner Area: 1.0668.
Inner Buy Area: 1.0643.
Original Support: 1.0633.
Strong Support: 1.0623.
Breakout SELL Level: 1.0616.

More analysis - at instaforex.com
 
Technical analysis of EUR/USD for Apr 04, 2017

When the European market opens, some Economic Data will be released, such as Retail Sales m/m, and Spanish Unemployment Change. The US will release the Economic Data, too, such as IBD/TIPP Economic Optimism, Factory Orders m/m, and Trade Balance, so, amid the reports, EUR/USD will move in a low to medium volatility during this day.

TODAY'S TECHNICAL LEVEL:
Breakout BUY Level: 1.0720.
Strong Resistance:1.0713.
Original Resistance: 1.0703.
Inner Sell Area: 1.0693.
Target Inner Area: 1.0668.
Inner Buy Area: 1.0643.
Original Support: 1.0633.
Strong Support: 1.0623.
Breakout SELL Level: 1.0616.

More analysis - at instaforex.com
 
Technical analysis of EUR/USD for Apr 05, 2017

When the European market opens, some Economic Data will be released, such as Final Services PMI, German Final Services PMI, French Final Services PMI, Italian Services PMI, and Spanish Services PMI. The US will release the Economic Data, too, such as FOMC Meeting Minutes, Crude Oil Inventories, ISM Non-Manufacturing PMI, Final Services PMI, and ADP Non-Farm Employment Change, so, amid the reports, EUR/USD will move in a medium volatility during this day.

TODAY'S TECHNICAL LEVEL:
Breakout BUY Level: 1.0730.
Strong Resistance:1.0723.
Original Resistance: 1.0713.
Inner Sell Area: 1.0703.
Target Inner Area: 1.0678.
Inner Buy Area: 1.0653.
Original Support: 1.0643.
Strong Support: 1.0633.
Breakout SELL Level: 1.0626.

More analysis - at instaforex.com
 
Technical analysis of EUR/USD for Apr 06, 2017

When the European market opens, some Economic Data will be released, such as ECB Monetary Policy Meeting Accounts, French 10-y Bond Auction, Spanish 10-y Bond Auction, Retail PMI, and German Factory Orders m/m. The US will release the Economic Data, too, such as Natural Gas Storage, Unemployment Claims, and Challenger Job Cuts y/y, so, amid the reports, EUR/USD will move in a low to medium volatility during this day.

TODAY'S TECHNICAL LEVEL:
Breakout BUY Level: 1.0722.
Strong Resistance:1.0715.
Original Resistance: 1.0705.
Inner Sell Area: 1.0695.
Target Inner Area: 1.0670.
Inner Buy Area: 1.0645.
Original Support: 1.0635.
Strong Support: 1.0625.
Breakout SELL Level: 1.0618.

More analysis - at instaforex.com
 
Daily analysis of GBP/USD for April 07, 2017

GBP/USD is still looking for a strong catalyst that helps to ride the Cable in the bullish bias, and it continues to struggling with the resistance zone of 1.2522. If a breakout happens over there, a rally towards 1.2600 is likely to happen in the short term. If US NFP data comes below the expectations, such scenario could be possible.

H1 chart's resistance levels: 1.2522 / 1.2598
H1 chart's support levels: 1.2420 / 1.2333

Trading recommendations for today: Based on the H1 chart, buy (long) orders only if the GBP/USD pair breaks a bullish candlestick; the resistance level is at 1.2522, take profit is at 1.2598, and stop loss is at 1.2447.

More analysis - at instaforex.com
 
Elliott wave analysis of EUR/NZD for April 10 - 2017

Wave summary:
EUR/NZD is not really doing anything at the moment. We continue to look for a break above 1.5347 as the go-signal for renewed upside pressure towards 1.5570 and possibly even closer to 1.5792 target. That said, support at 1.5151 will need to be able to protect the downside or a deeper correction closer to 1.5108 and possibly even closer to 1.4874 could be seen.

R3: 1.5457
R2: 1.5347
R2: 1.5312
Pivot: 1.5260
S1: 1.5183
S2: 1.5151
S3: 1.5108

Trading recommendation:
We are long EUR from 1.5235 we will move our stop higher to 1.5095. If you are not long EUR yet, then buy a break above 1.5347 and start by using the same stop.

More analysis - at instaforex.com
 
Technical analysis of EUR/USD for Apr 11, 2017

When the European market opens, some Economic Data will be released, such as ZEW Economic Sentiment, Industrial Production m/m, and German ZEW Economic Sentiment. The US will release the Economic Data, too, such as 10-y Bond Auction, JOLTS Job Openings, and NFIB Small Business Index, so, amid the reports, EUR/USD will move in a low to medium volatility during this day.

TODAY'S TECHNICAL LEVEL:
Breakout BUY Level: 1.0649.
Strong Resistance:1.0642.
Original Resistance: 1.0632.
Inner Sell Area: 1.0622.
Target Inner Area: 1.0597.
Inner Buy Area: 1.0572.
Original Support: 1.0562.
Strong Support: 1.0552.
Breakout SELL Level: 1.0545.

More analysis - at instaforex.com
 
Technical analysis of EUR/USD for Apr 12, 2017

When the European market opens, some Economic Data will be released, such as German 10-y Bond Auction, and German WPI m/m. The US will release the Economic Data, too, such as Federal Budget Balance, 30-y Bond Auction, Crude Oil Inventories, and Import Prices m/m, so, amid the reports, EUR/USD will move in a low to medium volatility during this day.

TODAY'S TECHNICAL LEVEL:
Breakout BUY Level: 1.0660.
Strong Resistance:1.0653.
Original Resistance: 1.0643.
Inner Sell Area: 1.0633.
Target Inner Area: 1.0608.
Inner Buy Area: 1.0583.
Original Support: 1.0573.
Strong Support: 1.0563.
Breakout SELL Level: 1.0556.

More analysis - at instaforex.com
 
Technical analysis of EUR/USD for Apr 13, 2017

When the European market opens, some Economic Data will be released, such as French Final CPI m/m, and German Final CPI m/m. The US will release the Economic Data, too, such as Natural Gas Storage, Prelim UoM Inflation Expectations, Prelim UoM Consumer Sentiment, Core PPI m/m, Unemployment Claims, and PPI m/m, so, amid the reports, EUR/USD will move in a low to medium volatility during this day.

TODAY'S TECHNICAL LEVEL:
Breakout BUY Level: 1.0722.
Strong Resistance:1.0715.
Original Resistance: 1.0705.
Inner Sell Area: 1.0695.
Target Inner Area: 1.0670.
Inner Buy Area: 1.0645.
Original Support: 1.0635.
Strong Support: 1.0625.
Breakout SELL Level: 1.0618.

More analysis - at instaforex.com
 
Technical analysis of EUR/USD for Apr 17, 2017

When the European market opens, today, there is no Economic Data will be released. The US will release the Economic Data, too, such as NAHB Housing Market Index, and Empire State Manufacturing Index, so, amid the reports, EUR/USD will move in a low to medium volatility during this day.

TODAY'S TECHNICAL LEVEL:
Breakout BUY Level: 1.0660.
Strong Resistance:1.0653.
Original Resistance: 1.0643.
Inner Sell Area: 1.0633.
Target Inner Area: 1.0608.
Inner Buy Area: 1.0583.
Original Support: 1.0573.
Strong Support: 1.0563.
Breakout SELL Level: 1.0556.

More analysis - at instaforex.com
 
Back
Top