Wave Analysis from InstaForex

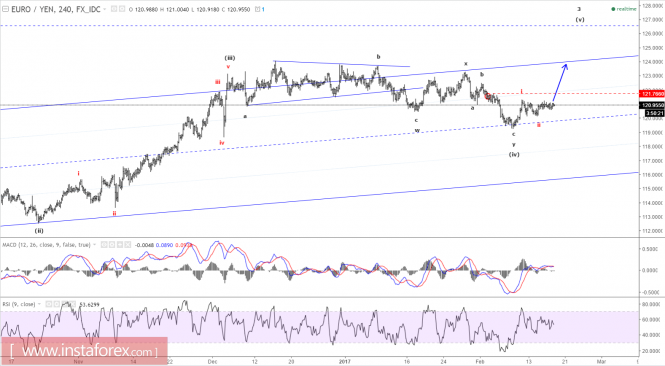
Technical analysis of EUR/USD for Jan 23, 2017

When the European market opens, some Economic Data will be released, such as Consumer Confidence. Today, the US will not release any economic data, so, amid the reports, EUR/USD will move in a low to medium volatility during this day.

TODAY'S TECHNICAL LEVEL:
Breakout BUY Level: 1.0775.
Strong Resistance:1.0769.
Original Resistance: 1.0758.
Inner Sell Area: 1.0747.
Target Inner Area: 1.0722.
Inner Buy Area: 1.0697.
Original Support: 1.0686.
Strong Support: 1.0675.
Breakout SELL Level: 1.0669.

More analysis - at instaforex.com
 
NZD/USD Intraday technical levels and trading recommendations for January 24, 2017

On November 8, significant signs of a bearish reversal were expressed around the upper limit of the depicted consolidation range (0.7350).
A bearish breakdown of 0.7250 (the lower limit of the depicted range) enhanced the bearish side of the market toward the price level of 0.7100 (recent bottom of October 28) which was broken as well.
Bearish persistence below 0.7100 allowed a quick decline toward 0.6960 (BUY zone) where bullish rejection and a valid BUY entry were expected. All T/P levels were successfully achieved.
Once again, bearish persistence below the price level of 0.7100 enabled the NZD/USD pair to pursue toward lower target levels around 0.6990 (the upper limit of the depicted BUY zone).
The price level of 0.6990 failed to apply enough bullish pressure. Instead of that, bearish movement continued toward the lower limit of the depicted BUY zone (0.6860) which provided significant bullish rejection on December 23.
The NZD/USD pair was trapped within the depicted price range (0.6860-0.6990) until a bullish breakout occurred.
A bullish breakout above 0.7000 allowed the pair to head toward the price level of 0.7100 (Key-Level) which failed to provide sufficient bearish pressure on the pair.
Instead, bullish persistence above 0.7100 (Key-Level) allows further bullish advance toward 0.7250 (SELL-ENTRY) where bearish rejection and a valid SELL entry can be offered.

More analysis - at instaforex.com
 
Technical analysis of EUR/USD for Jan 25, 2017

When the European market opens, some Economic Data will be released, such as Belgian NBB Business Climate, German 30-y Bond Auction and German Ifo Business Climate. The US will release the economic data, too, such as Crude Oil Inventories and HPI m/m, so, amid the reports, EUR/USD will move in a low to medium volatility during this day.

TODAY'S TECHNICAL LEVEL:
Breakout BUY Level: 1.0784.
Strong Resistance:1.0778.
Original Resistance: 1.0767.
Inner Sell Area: 1.0756.
Target Inner Area: 1.0731.
Inner Buy Area: 1.0706.
Original Support: 1.0695.
Strong Support: 1.0684.
Breakout SELL Level: 1.0678.

More analysis - at instaforex.com
 
Technical analysis of EUR/USD for Jan 26, 2017

When the European market opens, some Economic Data will be released, such as Italian 10-y Bond Auction, Italian Retail Sales m/m, GfK German Consumer Climate and Spanish Unemployment Rate. The US will release the economic data, too, such as Natural Gas Storage, CB Leading Index m/m, New Home Sales, Flash Services PMI, Prelim Wholesale Inventories m/m, Goods Trade Balance and Unemployment Claims, so, amid the reports, EUR/USD will move in a low to medium volatility during this day.

TODAY'S TECHNICAL LEVEL:
Breakout BUY Level: 1.0816.
Strong Resistance:1.0810.
Original Resistance: 1.0799.
Inner Sell Area: 1.0788.
Target Inner Area: 1.0763.
Inner Buy Area: 1.0738.
Original Support: 1.0727.
Strong Support: 1.0716.
Breakout SELL Level: 1.0710.

More analysis - at instaforex.com
 
Technical analysis of EUR/USD for Jan 27, 2017

When the European market opens, some Economic Data will be released, such as Private Loans y/y and M3 Money Supply y/y. The US will release the economic data, too, such as Revised UoM Inflation Expectations, Revised UoM Consumer Sentiment, Durable Goods Orders m/m, Advance GDP Price Index q/q, Core Durable Goods Orders m/m, and Advance GDP q/q, so, amid the reports, EUR/USD will move in a low to medium volatility during this day.

TODAY'S TECHNICAL LEVEL:
Breakout BUY Level: 1.0735.
Strong Resistance:1.0728.
Original Resistance: 1.0718.
Inner Sell Area: 1.0708.
Target Inner Area: 1.0683.
Inner Buy Area: 1.0658.
Original Support: 1.0648.
Strong Support: 1.0638.
Breakout SELL Level: 1.0631

More analysis - at instaforex.com
 
Daily analysis of USDX for January 30, 2017

The index stayed in a sideways range around the 200 SMA at H1 chart, looking to reach the resistance level of 101.43, as it already found a bottom at the 100.00 psychological zone across the board. If USDX manages to break above that resistance, we can expect a bullish week that put us in focus to target the 102.39 level as the next key area to the upside.

H1 chart's resistance levels: 101.43 / 102.39
H1 chart's support levels: 100.01 / 98.98

Trading recommendations for today:
Based on the H1 chart, place sell (short) orders only if the USD Index breaks with a bearish candlestick; the support level is at 100.01, take profit is at 98.98 and stop loss is at 101.03.

More analysis - at instaforex.com
 
Daily analysis of GBP/USD for January 31, 2017

GBP/USD weakened across the board during Monday's session and it's challenging the 200 SMA at H1 chart, where another bullish momentum can be seen. However, recent Brexit's developments couldn't help to lift the Sterling, in order to reach new highs in the short-term. However, if the pair plummets to 1.2420 and breaks it to the downside, then we can expect another decline toward 1.2294.

H1 chart's resistance levels: 1.2534 / 1.2645
H1 chart's support levels: 1.2420 / 1.2294

Trading recommendations for today: Based on the H1 chart, buy (long) orders only if the GBP/USD pair breaks a bullish candlestick; the resistance level is at 1.2534, take profit is at 1.2645 and stop loss is at 1.2421.

More analysis - at instaforex.com
 
Technical analysis of EUR/USD for Feb 01, 2017

When the European market opens, some Economic Data will be released, such as EU Economic Forecasts, Final Manufacturing PMI, German Final Manufacturing PMI, French Final Manufacturing PMI, Italian Manufacturing PMI, and Spanish Manufacturing PMI. The US will release the economic data, too, such as Federal Funds Rate, FOMC Statement, Total Vehicle Sales, Crude Oil Inventories, ISM Manufacturing Prices, Construction Spending m/m, ISM Manufacturing PMI, Final Manufacturing PMI, and ADP Non-Farm Employment Change, so, amid the reports, EUR/USD will move in a medium to high volatility during this day.

TODAY'S TECHNICAL LEVEL:
Breakout BUY Level: 1.0846.
Strong Resistance:1.0839.
Original Resistance: 1.0829.
Inner Sell Area: 1.0819.
Target Inner Area: 1.0794.
Inner Buy Area: 1.0769.
Original Support: 1.0759.
Strong Support: 1.0749.
Breakout SELL Level: 1.0742.

More analysis - at instaforex.com
 
Technical analysis of EUR/USD for Feb 02, 2017

When the European market opens, some Economic Data will be released, such as French 10-y Bond Auction, PPI m/m, ECB Economic Bulletin, and Spanish Unemployment Change. The US will release the economic data, too, such as Natural Gas Storage, Prelim Unit Labor Costs q/q, Prelim Nonfarm Productivity q/q, Unemployment Claims, and Challenger Job Cuts y/y, so, amid the reports, EUR/USD will move in a low to medium volatility during this day.

TODAY'S TECHNICAL LEVEL:
Breakout BUY Level: 1.0846.
Strong Resistance:1.0839.
Original Resistance: 1.0827.
Inner Sell Area: 1.0815.
Target Inner Area: 1.0787.
Inner Buy Area: 1.0758.
Original Support: 1.0746.
Strong Support: 1.0734.
Breakout SELL Level: 1.0727.

More analysis - at instaforex.com
 
Technical analysis of EUR/USD for Feb 07, 2017

When the European market opens, some Economic Data will be released, such as Sentix Investor Confidence, Retail PMI, and German Factory Orders m/m. The US will release the economic data, too, such as Loan Officer Survey, Labor Market Conditions Index m/m, and Mortgage Delinquencies, so, amid the reports, EUR/USD will move in a low to medium volatility during this day.

TODAY'S TECHNICAL LEVEL:
Breakout BUY Level: 1.0835.
Strong Resistance:1.0828.
Original Resistance: 1.0818.
Inner Sell Area: 1.0808.
Target Inner Area: 1.0783.
Inner Buy Area: 1.0758.
Original Support: 1.0748.
Strong Support: 1.0738.
Breakout SELL Level: 1.0731.

More analysis - at instaforex.com
 
Technical analysis of EUR/USD for Feb 08, 2017

When the European market opens, some Economic Data will be released, such as German 10-y Bond Auction, and EU Economic Forecasts. The US will release the economic data, too, such as 10-y Bond Auction, and Crude Oil Inventories, so, amid the reports, EUR/USD will move in a low to medium volatility during this day.

TODAY'S TECHNICAL LEVEL:
Breakout BUY Level: 1.0728.
Strong Resistance:1.0721.
Original Resistance: 1.0711.
Inner Sell Area: 1.0701.
Target Inner Area: 1.0676.
Inner Buy Area: 1.0651.
Original Support: 1.0641.
Strong Support: 1.0631.
Breakout SELL Level: 1.0624.

More analysis - at instaforex.com
 
Technical analysis of EUR/USD for Feb 09, 2017

When the European market opens, some Economic Data will be released, such as German Trade Balance. The US will release the economic data, too, such as 30-y Bond Auction, Natural Gas Storage, Final Wholesale Inventories m/m, and Unemployment Claims, so, amid the reports, EUR/USD will move in a low to medium volatility during this day.

TODAY'S TECHNICAL LEVEL:
Breakout BUY Level: 1.0738.
Strong Resistance:1.0731.
Original Resistance: 1.0721.
Inner Sell Area: 1.0711.
Target Inner Area: 1.0686.
Inner Buy Area: 1.0661.
Original Support: 1.0651.
Strong Support: 1.0641.
Breakout SELL Level: 1.0634.

More analysis - at instaforex.com
 
Technical analysis of USD/JPY for Feb 10, 2017

In Asia, Japan will release the Tertiary Industry Activity m/m and PPI y/y data, and the US will release some Economic Data, such as Federal Budget Balance, Prelim UoM Inflation Expectation, Prelim UoM Consumer Sentiment, and Import Prices m/m. So, there is a probability the USD/JPY will move with low to medium volatility during this day.

TODAY'S TECHNICAL LEVEL:
Resistance. 3: 114.27.
Resistance. 2: 114.05.
Resistance. 1: 113.82.
Support. 1: 113.55.
Support. 2: 113.32.
Support. 3: 113.10.

More analysis - at instaforex.com
 
Technical analysis of EUR/USD for Feb 14, 2017

When the European market opens, some Economic Data will be released, such as EU Economic Forecasts, ZEW Economic Sentiment, Industrial Production m/m, German ZEW Economic Sentiment, Flash GDP q/q, Italian Prelim GDP q/q, German Final CPI m/m and German Prelim GDP q/q. The US will release the economic data, too, such as Core PPI m/m, PPI m/m, NFIB Small Business Index, so, amid the reports, EUR/USD will move in a low to medium volatility during this day.

TODAY'S TECHNICAL LEVEL:
Breakout BUY Level: 1.0651.
Strong Resistance:1.0644.
Original Resistance: 1.0634.
Inner Sell Area: 1.0624.
Target Inner Area: 1.0599.
Inner Buy Area: 1.0574.
Original Support: 1.0564.
Strong Support: 1.0554.
Breakout SELL Level: 1.0547.

More analysis - at instaforex.com
 
Daily analysis of USDX for February 15, 2017

USDX got a bullish momentum during Tuesday's session after Yellen's speech at a Senate committee. It's now testing the resistance zone of 101.40, where a breakout should deliver more bullish bias toward 102.39, in an effort to strengthen the bullish scenario for the short-term. If the index does a pullback at the current stage, then we can expect a decline to test the 100.00 handle.

H1 chart's resistance levels: 101.43 / 102.38
H1 chart's support levels: 100.01 / 98.98

Trading recommendations for today: Based on the H1 chart, place sell (short) orders only if the USD Index breaks with a bearish candlestick; the support level is at 100.01, take profit is at 98.98 and stop loss is at 101.03.

More analysis - at instaforex.com
 
Daily analysis of GBP/USD for February 16, 2017

The pair was trading in a bearish tone during Wednesday's session, consolidating its price action below the 200 SMA at H1 chart and that should be giving us a hint of further declines in the short-term. If GBP/USD manages to break below the support zone of 1.2414, then we can expect another bearish advance toward 1.2360. MACD indicator is entering the positive territory, favoring to a possible recovery in the Cable.

H1 chart's resistance levels: 1.2480 / 1.2561
H1 chart's support levels: 1.2414 / 1.2360

Trading recommendations for today: Based on the H1 chart, buy (long) orders only if the GBP/USD pair breaks a bullish candlestick; the resistance level is at 1.2480, take profit is at 1.2561 and stop loss is at 1.2398.

More analysis - at instaforex.com
 
Elliott wave analysis of EUR/JPY for February 17, 2017

analytics58a6954326ef8.png


Wave summary:

We continue to look for a break above minor resistance seen at 121.05 and more importantly a break above resistance at 121.77 that will confirm red wave iii higher to at least 123.47 is unfolding. Short-term we expect minor support seen at 120.65 will be able to protect the downside for the expected break above 121.05. However, a break below 120.65 will delay the expected rally in red wave iii for a move closer to 120.18 before higher again.

R3: 122.01
R2: 121.73
R1: 121.33
Pivot: 120.95
S1: 120.65
S2: 120.18
S3: 120.10

Trading recommendation:
We are long EUR from 120.15 with stop a break-even. If you are not long you yet, then buy a break above 121.05 and use the same stop at 120.15.

InstaForex analytical reviews will make you fully aware of market trends!
Being an InstaForex client, you are provided with a large number of free services for efficient trading.

More analysis - at instaforex.com
 
Technical analysis of EUR/USD for Feb 20, 2017

When the European market opens, some Economic Data will be released, such as Consumer Confidence and German PPI m/m. The US today will not release any Economic Data, so, amid the reports, EUR/USD will move in a low to medium volatility during this day.

TODAY'S TECHNICAL LEVEL:
Breakout BUY Level: 1.0669.
Strong Resistance:1.0662.
Original Resistance: 1.0652.
Inner Sell Area: 1.0642.
Target Inner Area: 1.0617.
Inner Buy Area: 1.0592.
Original Support: 1.0582.
Strong Support: 1.0572.
Breakout SELL Level: 1.0565.

More analysis - at instaforex.com
 
Elliott wave analysis of EUR/NZD for February 21, 2017

Wave summary:
We continue to look for a firm break above resistance at 1.4866 that finally will confirm that a long-term low is in place at 1.4495 and a new impulsive rally higher in wave 3 has begun. The first minor targets to look for is seen at 1.5282 and at 1.5516 on the way towards 1.5836 that is expected to mark the first more substantial resistance. But first we need that break above 1.4866.
R3: 1.5000
R2: 1.4945
R1: 1.4866
Pivot: 1.4800
S1: 1.4745
S2: 1.4675
S3: 1.4620

Trading recommendation:
We are long EUR from 1.4844 with stop placed at 1.4490. If you are not long EUR yet, then buy a break above 1.4866 and use the same stop at 1.4490

More analysis - at instaforex.com
 
Elliott wave analysis of EUR/NZD for February 22, 2017

Wave summary:
We still need a firm break above important resistance seen at 1.4866 to confirm that a long-term low is in place with the test of 1.4495 and a new long-term impulsive rally has begun. Short term, we need to accept a more complex wave [ii] correction unfolding to just below 1.4618 as long as important resistance at 1.4866 holds firm. Under no circumstances can a break below 1.4495 be allowed under this count.

R3: 1.4955
R2: 1.4866
R1: 1.4803
Pivot: 1.4718
S1: 1.4661
S2: 1.4610
S3: 1.4571

Trading recommendation:
We are long EUR from 1.4840 with stop placed at 1.4490. If you are not long EUR yet, then buy a break above 1.4866 and use the same stop at 1.4490.

More analysis - at instaforex.com
 
Back
Top