Forex Analysis & Reviews: Forecast for GBP/USD on February 28, 2023
This information is provided to retail and professional clients as part of marketing communication. It does not contain and should not be construed as containing investment advice or investment recommendation or an offer or solicitation to engage in any transaction or strategy in financial instruments. Past performance is not a guarantee or prediction of future performance. Instant Trading EU Ltd. makes no representation and assumes no liability as to the accuracy or completeness of the information provided, or any loss arising from any investment based on analysis, forecast or other information provided by an employee of the Company or otherwise. Full disclaimer is available here:
https://www.instaforex.eu/disclaimer
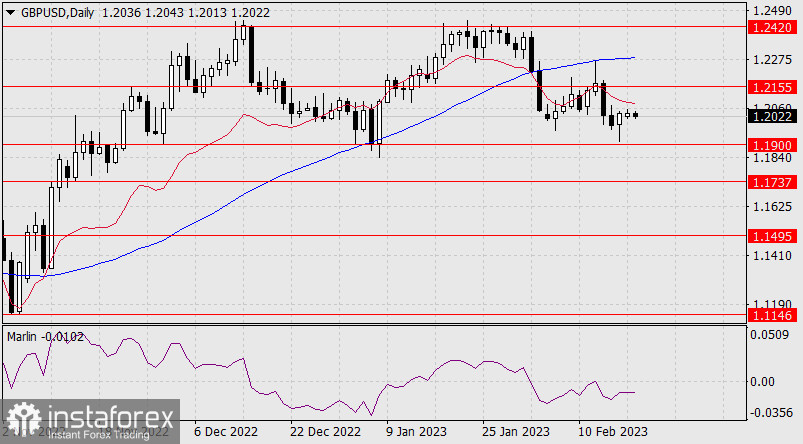
Yesterday, the pound made a big gain ahead of the currency market (122 points). The price overcame the signal level of 1.2030 and now it is aiming for the target level of 1.2155. On the daily chart, the signal line of the Marlin oscillator turned out to have made a false plunge under the graphical linear support (turquoise line).
The oscillator's move into positive territory has now dramatically increased the odds. An important sign of the price reversal in the medium-term growth will be its consolidation above 1.2155, the final sign - over the MACD line (1.2315). But this, of course, is an alternative scenario. In current conditions, I don't expect the pound to climb above 1.2155. If such growth happens, it is very likely to be false.
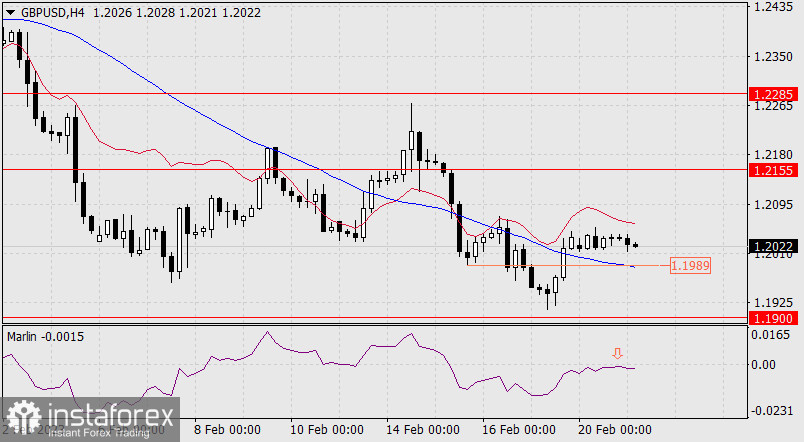
On the four-hour chart, so far, the situation supports the growth scenario - the price is above the indicator lines, and after the reversal from the MACD line, the Marlin oscillator is in a position to rise. We're waiting for the completion of the growing branch of the 133.90-137.70 range.
On the four-hour chart, the price has consolidated above both indicator lines, the Marlin has settled in the uptrend zone. We are waiting for the end of the pound's bullish correction. The opposite signal, confirming the reversal in the medium-term decline, will be the price moving below the MACD line (1.1980).
Analysis are provided by InstaForex
Read More
https://ifxpr.com/3ItWedm