Wave Analysis from InstaForex

FOREX ANALYSIS & REVIEWS: FORECAST FOR EUR/USD ON MARCH 10, 2023

Yesterday, the euro managed to develop a correction so that it can reach the target level of 1.0595 this morning. The price returned to the consolidation range of the second half of December 2022, and can stay there until the release of the US employment data. Also, the price may settle below 1.0595, as the trading volumes have noticeably decreased in recent days.

analytics640a9a68c5e90.jpg


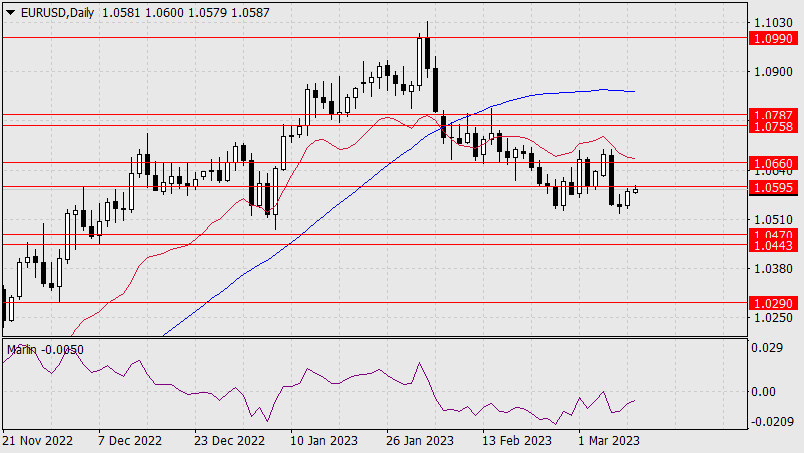
We expect today's Nonfarm Payrolls to be good as weekly jobless claims are coming in at a consistently low 196,000 on average over the past month. A month earlier, the average was 189,000 and then, in January, Nonfarm Payrolls showed an increase of 517,000 new jobs. Forecast for February is 205,000, the data is likely to be better than forecast. I expect the euro to fall to the target range of 1.0443/70.

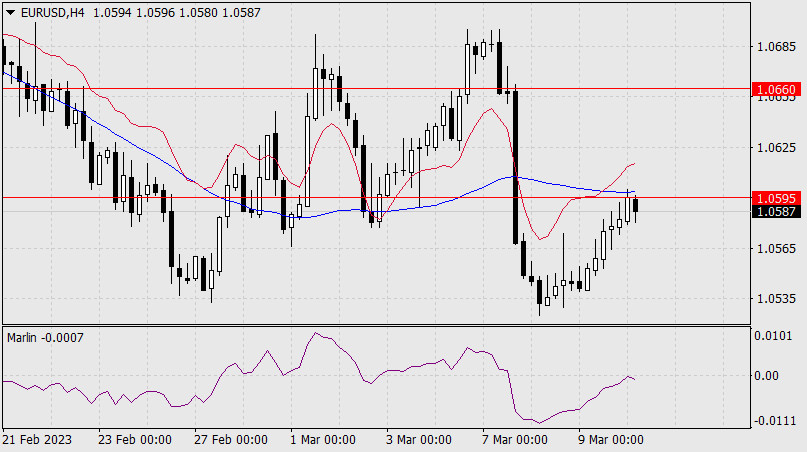
On the four-hour chart, the price has stopped rising in the area where the MACD indicator line coincides with the target resistance of 1.0595. The signal line of the Marlin oscillator closely approached the zero neutral line.There is a high probability that the price will reverse to the downside. In the main bearish scenario, the price can also climb above the resistance, but this will be a false breakout.

analytics640a9a5a14ecd.jpg


(Disclaimer)
*The market analysis posted here is meant to increase your awareness, but not to give instructions to make a trade.

Analysis are provided by InstaForex.

Read More
 
FOREX ANALYSIS & REVIEWS: TRADING SIGNAL FOR GBP/USD FOR MARCH 13 - 14, 2023: BUY ABOVE 1.2052 OR SELL AFTER PULLBACK AT 1.2140 (200 EMA - GAP

Early in the European session, the British pound is trading around 1.2071 above the 200 EMA above the 21 SMA. We can see that the GBP/USD pair opened this week's trade with a bullish gap.

The market sentiment is bullish and is being supported by the 200 EMA. It is likely to continue to rise in the next few hours and reach the maximum of 1.2140, the level seen on February 21 and 28.

This zone between the levels of 1.2140 -1.2161 (daily resistance_1) could act as a strong barrier for the British pound since in February, it acted as strong resistance twice.

In case of a pullback towards 1.2140 - 1.2161, we could sell with targets of 1.2085 (3/8 Murray) and 1.2050 (200 EMA).

If the British pound falls below the 200 EMA and trades on 4-hour charts below this level, we can expect it to fill the gap left around 1.2030 and reach support at 2/8 Murray at 1.19162.

In the event that the British pound trades below 4/8 Murray located at 1.2207 or any technical rebound in this area, we could see a signal to sell. In this case, the pair could reach 1.2000 in the next few days and even could fall to 1.1840 (1/8 Murray).

(Disclaimer)
*The market analysis posted here is meant to increase your awareness, but not to give instructions to make a trade.

Analysis are provided by InstaForex

Read More https://ifxpr.com/3ZZMnTZ
 
FOREX ANALYSIS & REVIEWS: FORECAST FOR GBP/USD ON MARCH 14, 2023

The pound continued its irrepressible growth yesterday, adding one and a half figures and overcoming the target level of 1.2155. It did not settle above this level, and this morning, it fell below it.

Most likely, the price can now head to close the opening gap of the week (1.2028). The Marlin oscillator has marked the beginning of the reversal. On the four-hour chart, there are no obvious reversal signs yet, the signal line of the oscillator should decrease even more. The first step will be the price settling under 1.2155.

If the price is able to exceed yesterday's high of 1.2198, it may continue to rise to the MACD line around 1.2272 on the daily chart.

(Disclaimer)
*The market analysis posted here is meant to increase your awareness, but not to give instructions to make a trade.

Analysis are provided by InstaForex

Read More https://ifxpr.com/3yAwuaP
 
ELLIOTT WAVE ANALYSIS OF EUR/USD FOR MARCH 15, 2023

EUR/USD has consolidated just above the double bottom neckline near 1.0710 and is ready to push higher towards the next minor resistance at 1.0807. EUR/USD is making its way higher to the 1.1248 target and possibly even closer to 1.1424 before wave 5 is in place.

Support is seen at 1.0710 and then at 1.0636 which we expect will be able to act as a floor for the next impulsive rally higher towards 1.1248 and possibly higher.

Analysis are provided by InstaForex

Read More https://ifxpr.com/42atK1n
 
TRADING PLAN FOR US DOLLAR INDEX ON MARCH 16, 2023

Technical outlook:
The US dollar index slipped through 104.50 during the New York session on Wednesday as discussed earlier. The index is seen to be trading close to 104.10 at this point in writing as the bears remain inclined to come back in control intraday. Interim support is now in place at 103.00 and the bullish structure will remain intact until it holds well.

The US dollar index is currently working on its larger-degree rally between 100.50 and 105.50 as seen on the 4H chart here. The bears have been successful to drag prices lower towards 103.00, which is the Fibonacci 0.50 retracement of the above rally. Please note that the potential remains for a drag lower towards 102.50 if an Up Gartley is unfolding.

In that case, prices will test the Fibonacci 0.618 retracement around 102.50 before resuming its rally towards 106.50 and 109.00. Also, note that 102.50 is the Fibonacci 0.618 retracement of the above rally, hence the potential remains high for a bullish turn if prices manage to reach there. The overall direction remains higher against 100.50.

Trading idea:
A potential rally towards 106.00 and 109.00
Good luck!

Analysis are provided by InstaForex

Read More https://ifxpr.com/3LrWBby
 
FORECAST FOR AUD/USD ON MARCH 17, 2023

Yesterday, the Australian dollar decided to take advantage of the wave of optimism in European markets and rose by 40 points. In today's Asian session, it is gaining the same amount.

AUD might reach the target level of 0.6730, and on the daily chart, the signal line of the Marlin oscillator will reach its zero line by that time. After that a synchronous reversal of the price and the oscillator from their resistances may follow.

On the four-hour chart, the price is rising after initial consolidation above the indicator lines and resistance level of 0.6640. If the price changes its mind to rise further, falling below the support of 0.6640 and under the MACD line (0.6630) will be a confirmation of it.

Analysis are provided by InstaForex

Read More https://ifxpr.com/3LuS208
 
NZDUSD, H4 | POTENTIAL BEARISH REVERSAL

The NZD/USD chart currently displays a bearish momentum, with price below a major descending trend line and the bearish Ichimoku cloud. The potential price movement could involve a bearish reaction off the 1st resistance, leading to a drop towards the 1st support level.

At 0.6097, the 1st support level is a strong overlap support that lines up with the 38.20% Fibonacci retracement. If price drops below this level, the next support level it could reach is the 2nd support at 0.5897, which is a swing low support that has a 61.80% Fibonacci retracement lining up with it.

Alternatively, if price bounces from the 1st support level, it could rise to the 1st resistance level at 0.6284, which is a pullback resistance. Beyond that, the 2nd resistance level at 0.6476 is a significant multi-swing high resistance.

Analysis are provided by InstaForex

Read More https://ifxpr.com/4021LiZ
 
FORECAST FOR EUR/USD ON MARCH 21, 2023

Yesterday, the euro was up 53 points, having overcome not only the balance indicator line on the daily chart, but it had also gotten through the collapse of the eurozone trade balance for January at -30.6bn against the forecast of -12.5bn and -8.8bn in December. The signal line of the Marlin oscillator, which we considered in yesterday's review, reached the March 15 high, from which the oscillator, and the price behind it, may reverse to the downside.

If the price ignores today's ZEW eurozone economic sentiment indicator, which is expected to decline from 29.7 to 23.2 in the March estimate, the price might reach the 1.0758/87 target range. If expectations of the Federal Reserve's rate hike at tomorrow's meeting comes to the fore, the price will turn around towards 1.0660.

On the four-hour chart, the price is rising above the indicator lines, the Marlin oscillator is rising quietly in the area of the uptrend. In general, we can say that the price is in a neutral state. I still expect the euro to fall.

Analysis are provided by InstaForex

Read More https://ifxpr.com/3lBIoya
 
WTI, H4 | POTENTIAL REVERSAL?

WTI crude oil has been experiencing bearish momentum lately, potentially leading to a bearish reaction off the first resistance at 70.38 and a drop towards the first support at 67.02. The second support level at 64.36 is also expected to act as support due to its multi-swing low status. The first resistance level at 70.38 is an overlap resistance, with the second resistance level at 73.40 being a 50% Fibonacci retracement level. There is also an intermediate resistance level at 69.75. Overall, the chart's momentum is bearish

Analysis are provided by InstaForex

Read More https://ifxpr.com/3yVhOTN
 
INDICATOR ANALYSIS: DAILY REVIEW OF GBP/USD ON MARCH 23, 2023

Trend analysis (Fig. 1).
The pound-dollar pair may move upward from the level of 1.2265 (closing of yesterday's daily candle) to the target at 1.2352, the 85.4% pullback level (blue dotted line). When testing this level, the price may continue to move upward with the target at 1.2446, the upper fractal (blue dotted line).

Fig. 1 (daily chart).
Comprehensive analysis:
Indicator analysis - up;
Fibonacci levels - up;
Volumes - up;
Candlestick analysis - up;
Trend analysis - up;
Bollinger bands - up;
Weekly chart - up.

General conclusion:
Today, the price may move upward from the level of 1.2265 (closing of yesterday's daily candle) to the target at 1.2352, the 85.4% pullback level (blue dotted line). When testing this level, the price may continue to move upward with the target at 1.2446, the upper fractal (blue dotted line).

Alternatively, the price may move upward from the level of 1.2265 (closing of yesterday's daily candle) to the target at 1.2352, the 85.4% pullback level (blue dotted line). From this level, a downward movement is possible with the target at 1.2256, the 14.6% pullback level (yellow dotted line).

Analysis are provided by InstaForex

Read More https://ifxpr.com/3K1gdCf
 
BTCUSD, H4 | POTENTIAL REVERSAL FROM A KEY LEVEL ?

The BTC/USD chart is currently bearish, indicating potential further price drops. The first resistance level at 28342 could prompt a bearish reaction towards the first support level at 26557. This support level is an overlap support with a 23.60% Fibonacci retracement, which could be a strong buying interest area. If broken, the price could fall towards the second support level at 25204, which is also an overlap support with a 38.20% Fibonacci retracement.

On the resistance side, the first resistance level at 28342 is a multi-swing high resistance that could lead to significant selling pressure. Breaking through it may drive the price towards the second resistance level at 31662, a swing high resistance.

Analysis are provided by InstaForex

Read More https://ifxpr.com/40bxtKV
 
BTC UPDATE FOR MARCH 27,.2023 - TIGHT RANGE AND POTENTIAL FOR THE BREAKOUT

BTC/USD has been trading sideways at the price of $27.800 and I see potetnial for the breakout mode.
Due to the strong upside cycle in the background and higher lows on H4, I see potential for the upside continuation.
In case of the breakout of resistance at $28.500, I see potential rally towards $32.000 and $35.000
Additionally, I found contraction of Bolinger Bands, which is another confirmation of the potential breakout regime.

Analysis are provided by InstaForex

Read More https://ifxpr.com/3TLiUuY
 
TECHNICAL ANALYSIS OF GBP/USD FOR MARCH 28, 2023

Overview :

The GBP/USD pair traded higher and closed the day in the positive territory near the price of 1.2208. Right now, it was trading in a narrow range of 1.2150 staying close to a 2-days high. On the hourly chart, the GBP/USD pair is still trading above the MA (100) H1 moving average line (1.2068 - weekly pivot point). The situation is similar on the 4-hour chart. Based on the foregoing, it is probably worth sticking to the north direction in trading, and as long as the GBP/USD pair remains above MA 100 H1, it may be necessary to look for entry points to buy for the formation of a correction.

All elements being clearly bullish, it would be possible for traders to trade only long positions on the GBP/USD pair as long as the price remains well above the golden ratio of 1.2068. The buyers' bullish objective is set at 1.2209.

The price is likely to form a double top in the same time frame. Accordingly, the GBP/USD pair is showing signs of strength following a breakout of the highest level of 1.2209. So, buy above the level of 1.2068 with the first target at 1.2209 in order to test the daily resistance 1.

The level of 1.2209 is a good place to take profits. Moreover, the RSI is still signaling that the trend is upward as it remains strong above the moving average (100). This suggests that the pair will probably go up in coming hours.

A bullish break in this resistance would boost the bullish momentum. Other outlook for the GBP/USD pair : Pound Sterling is currently trading at 1.2150. If the trend reverses from this point, then a possible future share price target could be 1.2209.

If the price of Pound Sterling is trading above 1.2150 then possibility of upside targets getting achieved is higher around the level of 1.2150.

The basic bullish trend is very strong on the GBP/USD pair, but the short term shows some signs of running out of steam. Nevertheless, a purchase could be considered as long as the price remains above 1.2150. Crossing the first resistance at 1.2209 would be a sign of a potential new surge in the price.

Buyers would then use the next resistance located at 1.2270 as an objective. Crossing it would then enable buyers to target 1.2270. Caution, a return to below 1.2270 would be a sign of a consolidation phase in the short-term basic trend.

If this is the case, remember that trading against the trend may be riskier. It would seem more appropriate to wait for a signal indicating reversal of the trend.

In the very short term, the general bullish sentiment is not called into question, despite technical indicators being indecisive.

All elements being clearly bullish market, it would be possible for traders to trade only long positions on the GBP/USD pair as long as the price remains well above the price of 1.2068.

The GBP/USD pair will continue rising from the level of 1.2068 in the long term. It should be noted that the support is established at the level of 1.2068 which represents the last bearish wave. The price is likely to form a double bottom in the same time frame.

Accordingly, the GBP/USD pair is showing signs of strength following a breakout of the highest level of 1.2068. So, buy above the level of 1.2068 with the first target at 1.2209 in order to test the daily resistance 1.

The buyers' bullish objective is set at the level of 1.2270 (last bullish wave). A bullish break in this resistance would boost the bullish momentum.

The buyers could then target the resistance located at 1.2270 . This suggests that the pair will probably go up in coming hours.

If the trend is able to break the level of 1.2209 (double top), then the market will call for a strong bullish market towards the objective of 1.2270 this week. If there is any crossing, the next objective would be the resistance located at 1.2270.

The level of 1.2270 is a good place to take profits. Moreover, the RSI is still signaling that the trend is upward as it remains strong above the moving average (100).

Since the trend is above the 61.8% Fibonacci level (1.2068), it means the market is still in a uptrend. From this point, the GBP/USD pair is continuing in a bullish trend from the new support of 1.2068. This is shown to us as the current price is in a bullish channel.

According to the previous events, we expect that the GBP/USD pair will move between 1.2068 and 1.2270 in coming hours. It is also should be noted, beware of bullish excesses that could lead to a possible short-term correction; but this possible correction would not be tradeable.

On the other hand, in case a reversal takes place and the GBP/USD pair breaks through the support level of 1.2068, a further decline to 1.1981 can occur. It would indicate a bearish market.

Analysis are provided by InstaForex

Read More https://ifxpr.com/40noDJX
 
TECHNICAL ANALYSIS OF DAILY PRICE MOVEMENT OF NATURAL GAS COMMODITY ASSET, WEDNESDAY MARCH 29 2023

If we look on the daily chart of Natural Gas commodity asset then it will seen that both of Moving Average is on Death Cross condition as well as supported by the appearance of Bearish 123 pattern follow by Ross Hook (RH) also Awesome Oscillator indicator was on negative area so in a few days ahead, Natural Gas has the potential to depreciated down below where the level of 1,967 will try to tested to break below, as long as there is no upward correction movement which is quite significant until it breaks above the level of 2,427, Natural Gas has the potential to continue its decline to the level of 1,785.

Analysis are provided by InstaForex

Read More https://ifxpr.com/40HmkRF
 
FORECAST FOR GBP/USD ON MARCH 30, 2023

Yesterday, the pound, as well as other world currencies (especially the yen), refused to reach technical levels and turned down instead. The pound lost 27 pips, giving up the 1.2420 target. However, this level is very strong, and testing it while the market is neutral is unlikely to provide the pound with more prospects.

Now, the price can overcome the support level at 1.2278 and go down to 1.2155 to assess the new balance of power, as it is the middle of the range since mid-December 2022.

On the four-hour chart, the Marlin oscillator signal line is entering the downtrend area. The price is approaching the support level at 1.2278. The MACD line reached this support level, i.e. these lines coincide on different scales. And if so, a breakthrough of the support will have a strong subsequent impact on the price.

Analysis are provided by InstaForex

Read More https://ifxpr.com/3JW3srp
 
FORECAST FOR AUD/USD ON MARCH 31, 2023

The Australian dollar broke through the upper limit of the neutral range that started back on March 17. AUD climbed out of this range this morning.

It could fall to the lower limit of the range, like it did on the 23rd, but the ascending Marlin oscillator creates an advantage for the growth option, at first to 0.6790 and then, under the favorable circumstances, to 0.6873.

On the four-hour chart, the price is in an active position to rise above the indicator lines, the Marlin is growing at an even angle, with an optimal speed to enter the overbought zone. After consolidating above 0.6730, we can expect the price to rise further. However, this plan can potentially be hindered by the price breaking through the MACD line, below the 0.6693 mark.

Analysis are provided by InstaForex

Read More https://ifxpr.com/3G5e6ed
 
Back
Top