Wave Analysis from InstaForex

Forex Analysis & Reviews: Forecast for USD/JPY on January 20, 2023

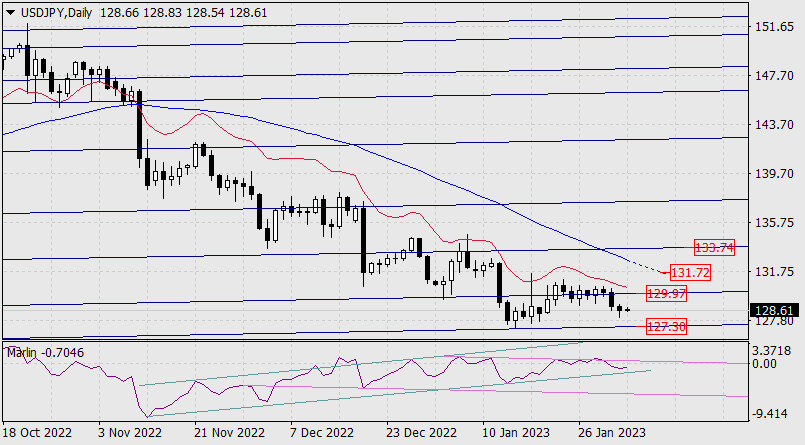
After the yen experienced increased volatility on Wednesday, the currency in question is moving sideways both yesterday and this morning as well. At the same time, traders are still bullish on the pair, the nearest target is 129.80, which is the line of the price channel on the higher chart. In case the quote continues to rise, the upper line of the descending green price channel is waiting around the 130.67 mark. Leaving the channel will open the next target at 133.60.

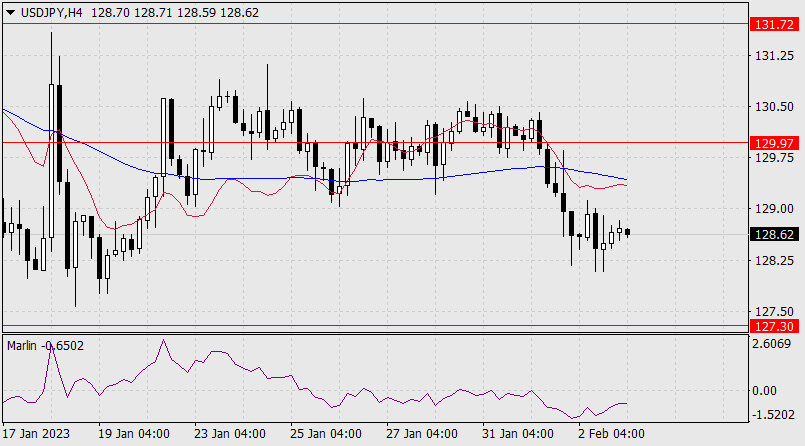
The Marlin oscillator supports the price growth by rising in its own ascending channel. Crossing the signal line of the oscillator above the zero line will strengthen the price growth. On the four-hour chart, the Marlin oscillator is rising in the green zone, but growth is hampered by resistance of the balance indicator line. The MACD line is currently above the price, above the resistance of 129.80 on the daily chart.

Also, considering the downtrend, we can assume other market obstacles to the pair's growth. With time, however, we still expect a full-fledged correction from the price decline from October 21.

*The market analysis posted here is meant to increase your awareness, but not to give instructions to make a trade.

Analysis are provided by InstaForex

Read More https://ifxpr.com/3XHpiEr
 
Forex Analysis & Reviews: Forecast for EUR/USD on January 23, 2023

The stock markets' brisk rise helped keep the euro from nearly an "imminent" breakthrough from the 9-month high. This morning, there is a gap. Even the signal line of the Marlin oscillator was above the divergence line.

We don't know why the S&P 500 rallied by 1.89% on Friday, almost simultaneously (since Thursday) with pension funds contributions being cut to delay the "shutdown", as the US starts a hot period of disputes about the limit of the national debt.

In the meantime, the euro is moving towards the target level of 1.0990. But the gap is open, and if it closes after crossing 1.0990 or if the price doesn't reach this mark, we don't know what will happen. I don't expect the euro to rise above 1.0990, we consider the given growth only as a temporary way out of the general strategy, which involves a decrease in risk appetite.

On the four-hour chart, nothing interferes with growth, except for the window at the opening of the session. The price is above the indicator lines and the Marlin oscillator is in a good position for growth. The growth is expected to be short-term.

*The market analysis posted here is meant to increase your awareness, but not to give instructions to make a trade.

Analysis are provided by InstaForex

Read More https://ifxpr.com/3j41HPr
 
Forex Analysis & Reviews: Forecast for EUR/USD on January 24, 2023

Investors are stubbornly buying stock market instruments and bringing confusion to the related currency market. Yesterday, the S&P 500 gained 1.19% and the euro gained 15 pips. There is a double divergence on the daily chart, but the market's desire to change this technical pattern is obvious. The 1.0990 target is getting closer.

The eurozone business activity indicator for January will be released this afternoon, the forecast is 50.2 points against 49.8 in December. In the US, this indicator may also show growth (the forecast is 45.0 vs. 44.7 previously), but manufacturing PMI is expected to weaken to 46.0 from 46.2 in December, while in Germany the Manufacturing PMI is expected to rise to 47.9 from 47.1. The euro can take advantage of this divergence.

On the four-hour chart, the upward trend is still present - the price is above the indicator lines and the Marlin is in a rising position. The closest signal to a downtrend will be when the price crosses the support of the MACD line, below 1.0824.

*The market analysis posted here is meant to increase your awareness, but not to give instructions to make a trade.

Analysis are provided by InstaForex

Read More https://ifxpr.com/3kEaisI
 
Forex Analysis & Reviews: Technical Analysis of Intraday Price Movement of Crude Oil Commodity Asset, Wednesday January 25, 2023.

On the 4th hour chart Crude Oil commodity asset seems that there is a discrepancy between the price movement and the Awesome Oscillator indicator which confirms that in the near future there will be a downward movement below the 79.66 level which is the Equal Low level so that if this level is successfully broken below then the 78.12 level will be the next target to be tested but if on the way down suddenly #CL turned up and penetrated the 82.62 level,it is very likely that the decline scenario that has been described will become invalid and cancel itself.

*The market analysis posted here is meant to increase your awareness, but not to give instructions to make a trade.

Analysis are provided by InstaForex

Read More https://ifxpr.com/3XWQMGg
 
Forex Analysis & Reviews: Forecast for EUR/USD on January 27, 2023

Yesterday, the euro failed to move towards the 1.0990 target and rolled back to Wednesday's initial positions. If today's U.S. consumer income/expenditure data is close to the forecast, the 1.0990 target will be much closer.

Consumer spending for December is expected to be down 0.1%, while income is expected to be up 0.2% after a 0.4% gain in November.

As before, the probability of forming a divergence between the price and the Marlin oscillator with the consequent reversal of the price into a medium-term decrease remains.

On the four-hour chart, the price returned above the MACD indicator line after a brief (and false) move below it. The same false movement was made by the Marlin oscillator yesterday. Currently, there is growth. Expect the day to close above Wednesday's closing level.

*The market analysis posted here is meant to increase your awareness, but not to give instructions to make a trade.

Analysis are provided by InstaForex

Read More https://ifxpr.com/409NpNW
 
Forex Analysis & Reviews: Technical Analysis of Daily price movement of GBP/USD Main Currency Pairs, Monday January 30, 2023

If we look at the daily chart for the main GBP/USD currency pair, then there will be some interesting things:

1. The appearance of the Double Top Pattern (Yellow circle).

2. Deviations appear between price movements and the MACD indicator.

3. The appearance of Bearish 123 pattern.

Based on the three facts above then in a few days ahead Cable has the potential to go down trying to break below the level 1,2262 as the main target to be tested if this level managed to break then 1,2086 will be the next target to be tested while on the way to these levels is not a upward correction which exceeds the 1.2447 level because if this level is successfully penetrated upwards then it is very likely that the decline scenario described earlier will become invalid and automatically cancel itself.

*The market analysis posted here is meant to increase your awareness, but not to give instructions to make a trade.

Analysis are provided by InstaForex

Read More https://ifxpr.com/3wGre4q
 
Forex Analysis & Reviews: Forecast for AUD/USD on January 31, 2023

The Australian dollar lost 47 points yesterday, it led losses, but technically there are no signs of a trend reversal yet. We just assume that the price broke off from the MACD indicator line, and now it is about to do that. There is a chance that the price will meet the MACD line near its intersection with the support level of 0.6873 (low of January 19, low of August 5, 2022).

The aussie fell this morning due to weak retail sales in December, which were down 3.9% vs. the forecast of -0.3%. A little later, the Chinese manufacturing activity index for January of 50.1 points against December's 47.0 points stopped the AUD/USD decline.

On the four-hour chart, the price settled below the MACD line. Also, the price overcame the support of the local low of January 25 (gray oval). The Marlin oscillator is in the area of the downtrend. We wait for the results of tomorrow's Federal Reserve meeting.

*The market analysis posted here is meant to increase your awareness, but not to give instructions to make a trade.

Analysis are provided by InstaForex

Read More https://ifxpr.com/3JuhXEi
 
Forex Analysis & Reviews: Technical Analysis of Intraday Price Movement of Gold Commodity Asset, Wednesday February 01 2023

On the 4-hour chart, it can be seen that this commodity asset is being held back by the Resistance level at 1930.52 so that in the near future it has the potential to depreciate to the level of 1900.38 where this has also been confirmed by the MA 10 which is below the MA 20 plus price movements inside the channel which go down indicated that the sellers were dominating the previous buyers. However, please pay attention if on the way down, this commodity asset suddenly reverses up and breaks the level of 1934.50, then it is very likely that the downward scenario described earlier will cancel itself.

*The market analysis posted here is meant to increase your awareness, but not to give instructions to make a trade.

Analysis are provided by InstaForex

Read More https://ifxpr.com/3wKBcBX
 
Forex Analysis & Reviews: AUDUSD Potential for Bullish rise to previous swing high


analytics62c4ffed07a5a_source!.jpg


Description :
Looking at the H4 chart, my overall bias for AUDUSD is bullish due to the current price being above the Ichimoku cloud, Looking for a buy entry at 0.71277 where the pullback entry and the 1st resistance level. We are looking to take profit at 0.72775, where the previous swing high is and -27.2% Fibonacci line. Stop loss will be placed at 0.69753 where the recent swing low support is.


Trading Recommendation


Entry: 0.71277


Reason for Entry: Ichimoku cloud + price momentum


Take Profit: 0.72775


Reason for Take Profit:


Previous swing high resistance


Stop Loss: 0.69753


Reason for Stop Loss:


recent swing low support


*The market analysis posted here is meant to increase your awareness, but not to give instructions to make a trade.


Analysis are provided byInstaForex.


Read More
 
Forex Analysis & Reviews: Forecast for USD/JPY on February 3, 2023


The Japanese yen got a little stronger after the meetings of the three major central banks, but it only strengthened the neutral position and uncertainty, since it is technically staying between the two lines of the price channel at 127.30 and 129.97.


analytics63dc71bd5bd4b.jpg


The signal line of the Marlin oscillator is in the negative zone, but it has not yet reached the bottom of its own ascending channel (turquoise). Considering the fact that the dollar has been rising against European currencies and the stock market is also rising, I believe that the price will climb above the resistance of 129.97. Then the price may overcome the resistance of the MACD line (131.72), and logically, the breakthrough will end by reaching the resistance of 133.74. The alternative scenario assumes overcoming the support at 127.30 and falling further to the underlying price channel line at 124.10.


analytics63dc71ae759ce.jpg


On the four-hour chart, the price is consolidating under the balance and MACD indicator lines, the Marlin oscillator is rising in the territory of the downtrend with the possible intention to move to the green zone. Let's wait for the resolution of the uncertainty when the US employment data comes out this evening.


*The market analysis posted here is meant to increase your awareness, but not to give instructions to make a trade.


Analysis are provided byInstaForex.


Read More
 
Forex Analysis & Reviews: Technical Analysis of Daily Price Movements of CAD/JPY Commodity Currency Pairs, Monday February 06 2023.

With the success of the CAD/JPY Commodity currency pair breaking above its Penant pattern which was followed by a deviation from the MACD Histogram indicator with price movements that were also above the Moving Average movement, we can conclude that Buyers are starting to return to CAD/JPY which will make this commodity currency pair have the potential to appreciate and rally upwards in the next few days to test the equal high level (liquidity gathering place) at 101.14 and 105.71 will be the targets of both, but if on the way to these target levels there is one and another thing that makes this currency pair return to its original bias (Bearish), especially if it manages to break below the 95.30 level, the upward rally scenario described earlier will become invalid and cancel itself.

*The market analysis posted here is meant to increase your awareness, but not to give instructions to make a trade.

Analysis are provided by InstaForex

Read More https://ifxpr.com/3X3o9Gp
 
Forex Analysis & Reviews: Forecast for EUR/USD on February 7, 2023

Yesterday, the euro managed to overcome the support of the 1.0758/87 target range as well as the MACD line, which has already been embedded. Now the nearest target is 1.0660, followed by 1.0595. The range of these levels represents the consolidation of December.

Traditionally, there is a correction after a sharp downtrend, afterwards, the pair will enter growth in the medium-term. It is possible for the pair to enter a bullish correction from the range of 1.0595-1.0660.

On the four-hour chart, the price has settled under the lower limit of the 1.0758/87 range, the signal line of the Marlin oscillator slightly turned up, and this range will probably be tested. I expect EUR/USD to fall further.

*The market analysis posted here is meant to increase your awareness, but not to give instructions to make a trade.

Analysis are provided by InstaForex

Read More https://ifxpr.com/3JMu7so
 
Forex Analysis & Reviews: Technical Analysis of Intraday Price Movements of USD/MXN currency pairs, Wednesday 08 February 2023

After succesfully break above the level 19,104 and after that USD/MXN currency pairs halted by the upward movement by the Dynamic Resistance (MA 200). Now USD/MXN is falling back down to test the 18,762 level. If this level is able to withstand the downward trend of USD/MXN, this currency pair has the potential to rise again if during a downward correction. there was no significant decline that passed below the 18,672 level where if this level was not broken then USD/MXN would have the potential to rally again up to the 19,213-19,398 area level as the first target and the 19,639-19,900 area level as the second target.

*The market analysis posted here is meant to increase your awareness, but not to give instructions to make a trade.

Analysis are provided by InstaForex

Read More https://ifxpr.com/3I9gTo4
 
Поисковая оптимизация (SEO) — это процесс оптимизации веб-сайта для повышения его видимости и рейтинга в поисковых системах, таких как Google, Bing и Yahoo. Цель SEO — привлечь органический (бесплатный) трафик на сайт со страниц результатов поисковых систем (SERP).
https://tudavam.ru - Продвижения в топ
 
Forex Analysis & Reviews: USDJPY analysis for February 9th, 2023

Yellow rectangle- support area
Green lines- expected path
Violet lines- Fibonacci retracement levels

USDJPY as expected has pulled back and closed the open gap from Monday's open. Price so far follows our expected price path towards 129.90-130.60 area where we expect to finish the counter trend move. Price is now testing the 50% Fibonacci retracement once again. This time expect to see a move below the 50% retracement towards the 61.8% level which is key support. We usually see trend reversals if price respects the 61.8% retracement. Because price formed 5 waves up from the 128 lows, I expect to see a retracement of this upward move with the formation of a higher low inside the yellow rectangle area.

*The market analysis posted here is meant to increase your awareness, but not to give instructions to make a trade.

Analysis are provided by InstaForex

Read More https://ifxpr.com/3lpOQYB
 
Forex Analysis & Reviews: Forecast for GBP/USD on February 10, 2023

My expectation that the British pound would reverse on Thursday did not materialize. On the contrary, the pound is up 50 pips. But the upper shadow is higher by 75 pips, which is a good sign of the reversal. The Fibonacci time zone tool had to be abandoned. Ideally, nothing has changed. I expect the pound to weaken along with other currencies because of the global strengthening of the dollar.

The pound may even go ahead of the market today, as weaker economic data is expected for the UK. Q4 GDP is forecast to show zero growth, December GDP may show a decline of 0.3%, annual GDP is expected to decline to 0.4% from the previous 1.9%, December industrial production may show a decline of 0.2%, trade balance is expected to deteriorate to -16.4 billion from the previous -15.6 billion. On the daily chart, the upper shadow pierced the resistance of 1.2155, the Marlin oscillator turned down in the downtrend zone. The nearest bearish target is 1.1933. On the four-hour chart, the growth was stopped by the MACD indicator line. Now the price has settled below 1.2155 and under the red balance line. Marlin turned down. So, we are waiting for today's UK reports and the pound to fall.

*The market analysis posted here is meant to increase your awareness, but not to give instructions to make a trade.

Analysis are provided by InstaForex

Read More https://ifxpr.com/3RVWYwj
 
раскрутка сайта в интернете - это процесс привлечения посетителей на сайт, использующий различные методы продвижения сайта, включая SEO, контекстную рекламу, социальные сети и т.д. Целью раскрутки является повышение посещаемости сайта, построение привлекательного онлайн-бренда и повышение прибыли.
Топ продвижение это
 
Forex Analysis & Reviews: Forecast for EUR/USD on February 13, 2023

The euro fell by 62 points on Friday. The price is very close to 1.0660, the upper limit of the consolidation range of December 16-26. Overcoming the support can push the price to 1.0595, it can fall further to the target level of 1.0470, the lows of June 22 and April 28, 2022. Also, this level is close to the 38% retracement of the entire growth since September 28.

The price has overcome the support of the balance and MACD indicator lines, the Marlin oscillator is declining in the red zone - a blatant downtrend.

On the four-hour chart, the price shows signs of consolidation before reaching the support of 1.0660, the Marlin has settled in the area of the downtrend. We can also see the price in preparation as it falls further.

*The market analysis posted here is meant to increase your awareness, but not to give instructions to make a trade.

Analysis are provided by InstaForex

Read More https://ifxpr.com/3RY8CXI
 
Продвижение в топ представляет собой целевую оптимизацию ваших сайтов или интернет-магазинов, для получения высоких позиций в поисковых системах. Наиболее эффективные методы для достижения высоких позиций включают оптимизацию контента, создание ссылок и повышение посещаемости вашего сайта.
<a href=https://tudavam.ru>Топ продвижение товара</a>
 
Forex Analysis & Reviews: Forecast for EUR/USD on February 14, 2023

The market was calm on Monday, without any upbeat news, the euro could not overcome the technical support at 1.0660, yesterday's growth was 45 pips. The euro continued to move sideways in the 1.0660-1.0758 range.

The best thing that the euro can do for the bearish scenario is to pierce the upper limit of the 1.0758/87 range. If the euro settles above the MACD line (above 1.0820), the alternative option is for the price to rise to 1.0990. I expect the price to cross 1.0660 and fall further to 1.0595.

On the four-hour chart, the signal line of the Marlin oscillator is in the green zone. This will help the price and if it doesn't overcome the nearest resistance, then it will linger in the sideways movement. At the moment, time is not on the euro's side, since the MACD line is getting closer to the price with each candle, and it increases the pressure.

*The market analysis posted here is meant to increase your awareness, but not to give instructions to make a trade.

Analysis are provided by InstaForex

Read More https://ifxpr.com/3XBFQxi
 
Back
Top