InstaForex Gertrude
Active member
Forecast for AUD/USD on April 9, 2020
AUD / USD
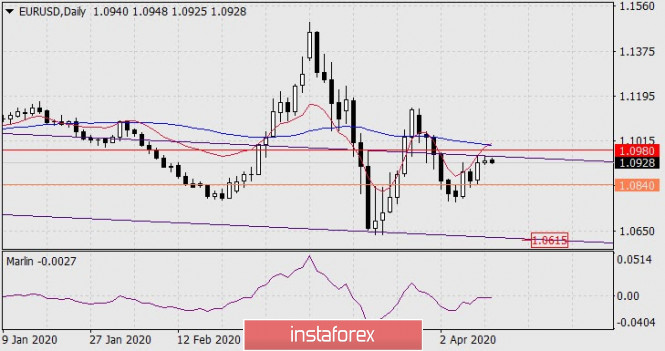
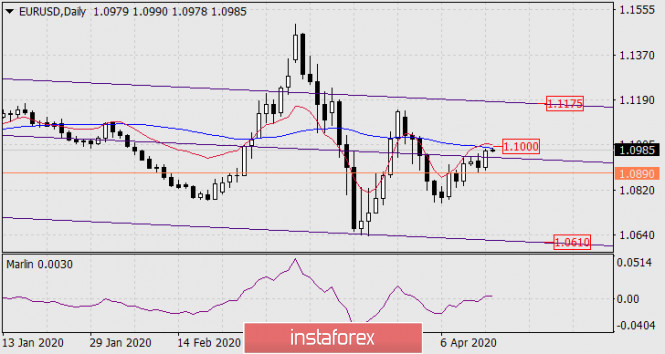
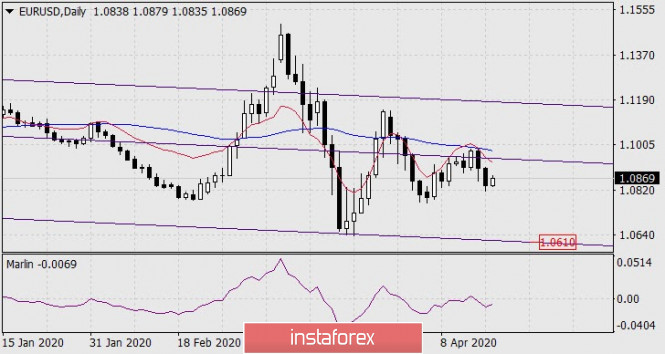
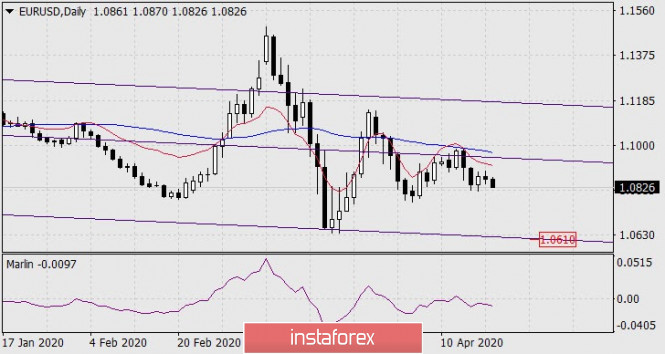
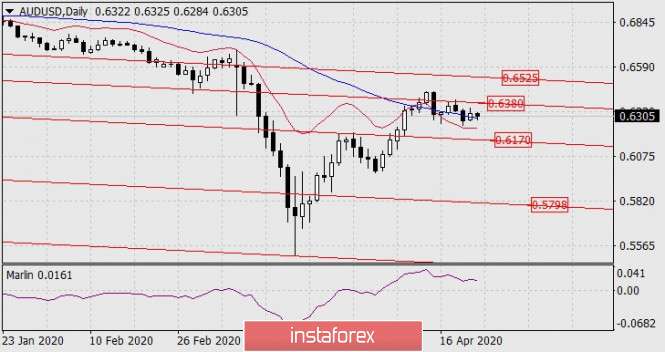
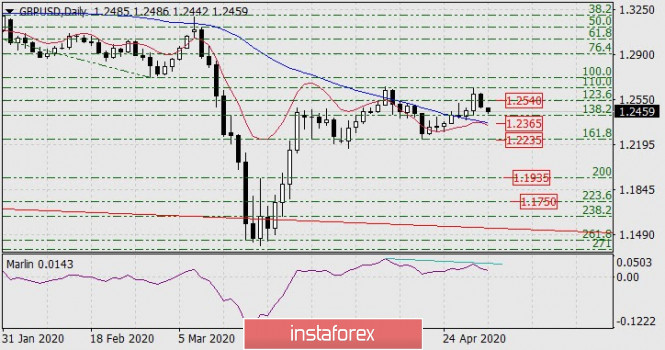
The Australian dollar reached its upper target of 0.6249 (February 2009 low) yesterday. Now, the question is: will it turn into a medium-term decline today, or mark the MACD line on the daily time frame (0.6354). The Marlin oscillator indicates a reversal, but it does not stop the price from rising by another hundred points.
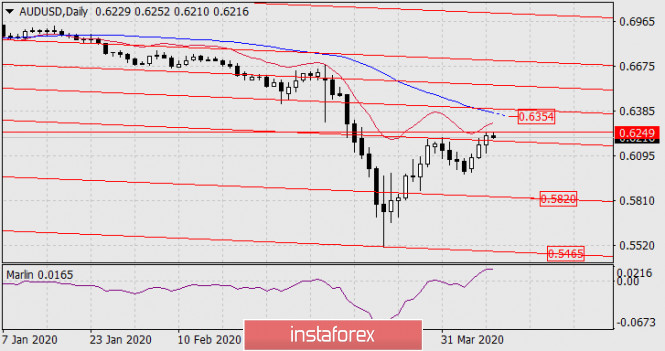
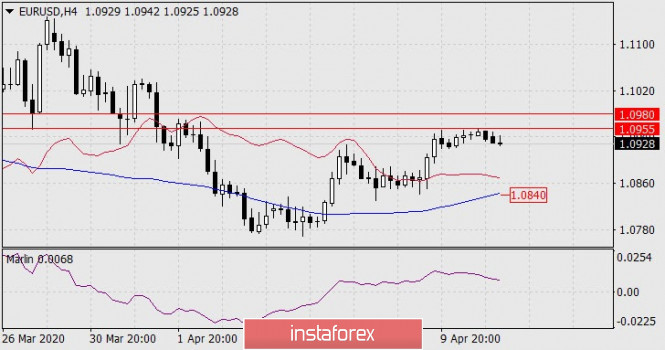
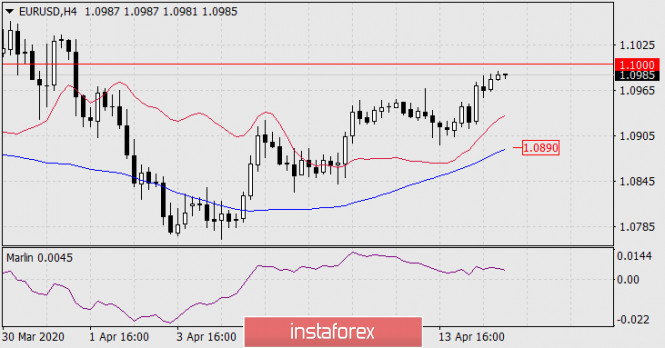
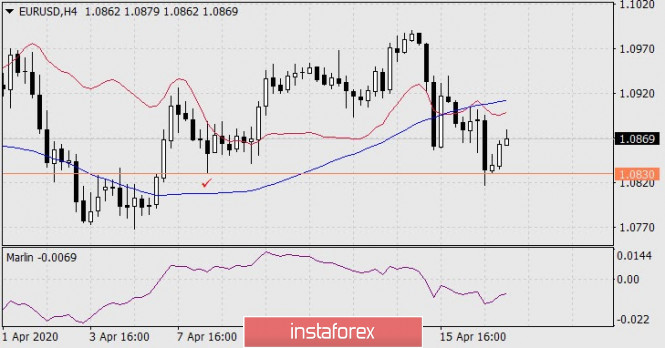
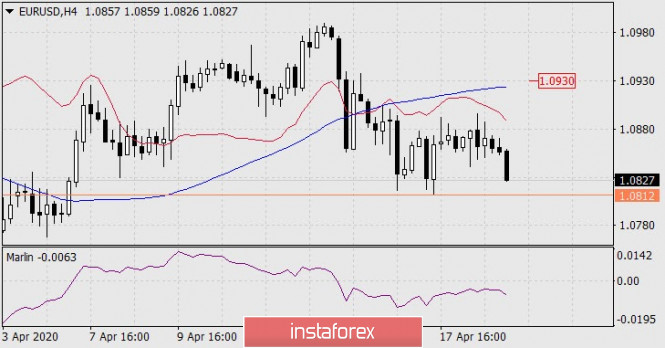
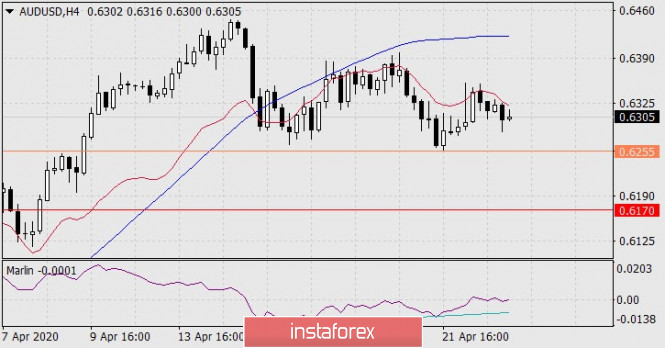
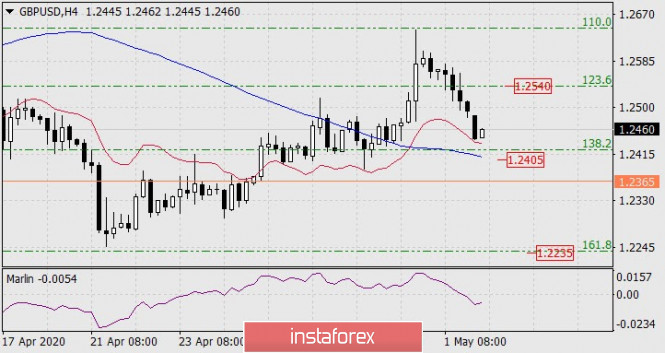
On the four-hour chart, there is a sign that an extended divergence on the Marlin oscillator is forming. The signal is twofold; on the one hand, it indicates the intention of the price to move downwards from the current levels, on the other, the divergence may dissolve in the continued growth of the indicator itself.
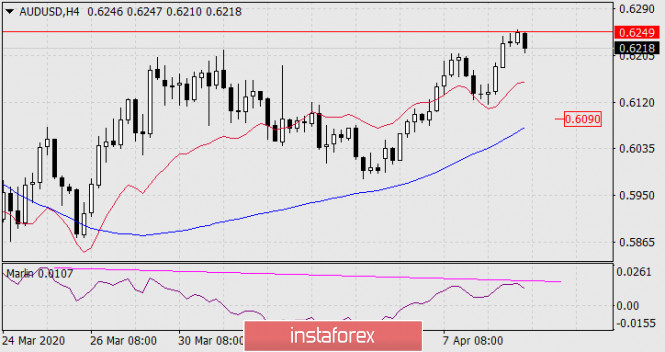
A clear signal of a trend reversal will be the price overcoming the support of the MACD line at around 0.6090.
So, with the price breaking the signal level of 0.6090, it is recommended to open short positions with a goal before 0.5820 and stop loss above 0.6115.
Analysis are provided byInstaForex.
AUD / USD
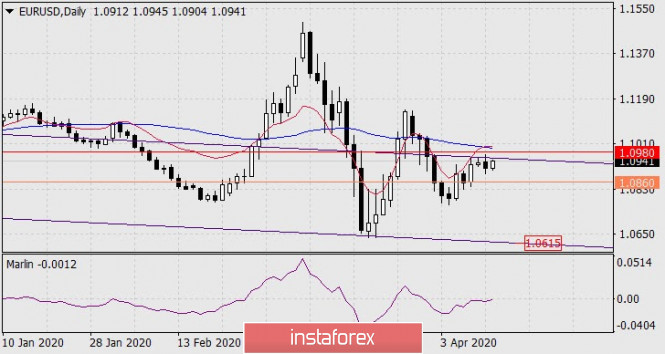
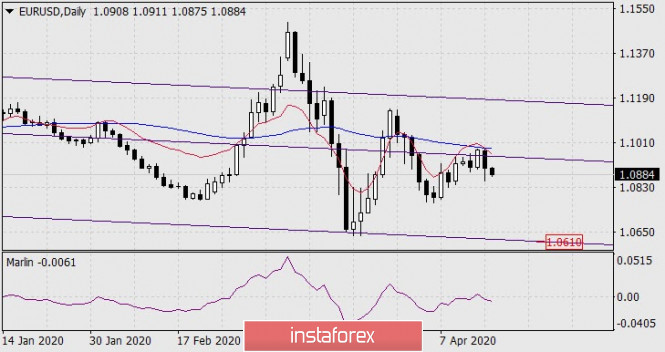
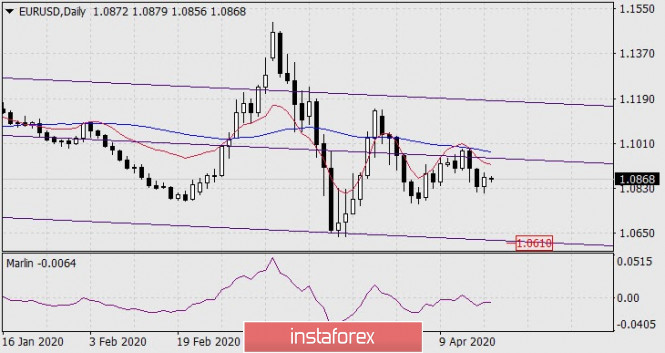
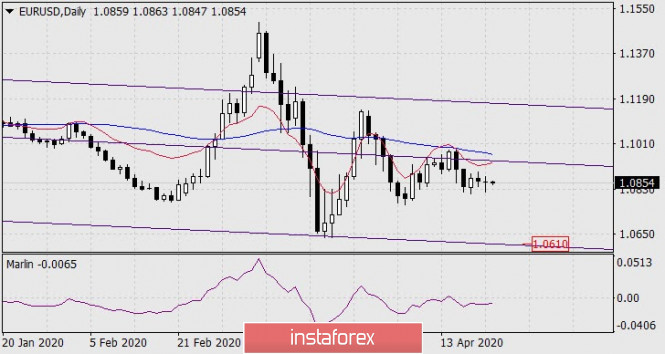
The Australian dollar reached its upper target of 0.6249 (February 2009 low) yesterday. Now, the question is: will it turn into a medium-term decline today, or mark the MACD line on the daily time frame (0.6354). The Marlin oscillator indicates a reversal, but it does not stop the price from rising by another hundred points.
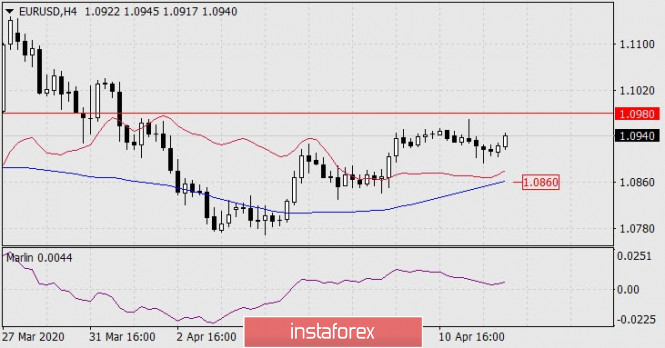
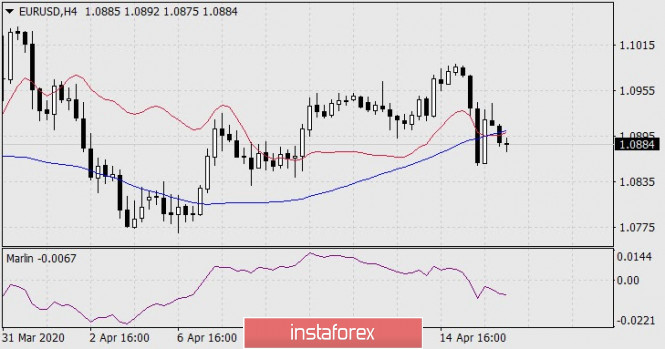
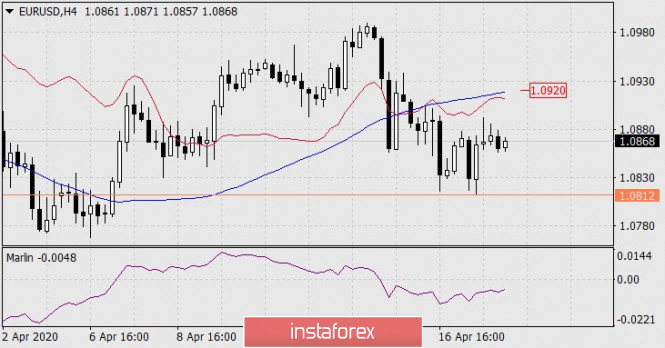
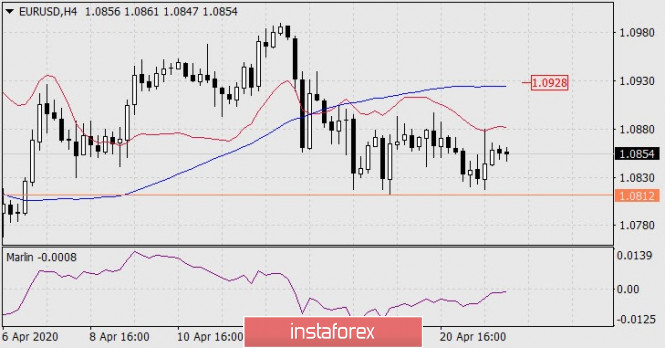
On the four-hour chart, there is a sign that an extended divergence on the Marlin oscillator is forming. The signal is twofold; on the one hand, it indicates the intention of the price to move downwards from the current levels, on the other, the divergence may dissolve in the continued growth of the indicator itself.
A clear signal of a trend reversal will be the price overcoming the support of the MACD line at around 0.6090.
So, with the price breaking the signal level of 0.6090, it is recommended to open short positions with a goal before 0.5820 and stop loss above 0.6115.
Analysis are provided byInstaForex.