Wave Analysis from InstaForex

Overview of the GBP/USD pair. February 11. Today could be a black day for the pound

4-hour timeframe

Technical details:
Higher linear regression channel: direction - up.
Lower linear regression channel: downward direction.
Moving average (20; smoothed) - down.
CCI: -79.5400
The GBP/USD currency pair continues to adjust on February 11. After the pair worked the Murray level "3/8" - 1.2878, there was a rebound, which provoked the beginning of the correction. Also there weren't any important publications or speeches by top officials in the United Kingdom and the United States on the first trading day of the week. Thus, traders were deprived of fundamental recharge on February 10. Therefore, Monday was, in principle, a good option for a correction, although we expected that the downward movement will continue. However, the Heiken Ashi indicator turned up and signaled a temporary break in the downward movement. It should also be noted that on Tuesday, that is, today, information from the UK that is of a very important degree of significance will come from the UK. Therefore, before such an important block of macroeconomic data, traders recorded part of the profit on short positions previously opened.

Now we turn directly to macroeconomic statistics. The most significant indicator, of course, will be the indicator of GDP. However, you should immediately make a reservation that tomorrow there will be at least four variations of this indicator, moreover, with different values. For example, GDP for December will be published, that is, in monthly terms with a forecast of +0.2%. An estimate of GDP growth rates from NIESR for January will also be published with a forecast of +0.2%. Preliminary data on Gross Domestic Product for the fourth quarter in annual and quarterly terms with forecasts of +0.8% and +0.0% from the National Statistics Office will be published. We believe that it is the last two indicators that are the most significant. Take a look at the chart.

Over the past three years, UK GDP has shown even more or less strong GDP growth. That is, each quarter there was an increase in comparison with the same quarter of the previous year by no less than 1.1%. 1.1% is, of course, not much, however. GDP forecasts for the fourth quarter of 2019 indicate that growth rates may decline to 0.8% y/y. That is, for the first time in the last three years (and in fact for the first time since 2010), the growth rate will be less than 1% y/y. This is what we have repeatedly said when we covered the problem of a slow down in Great Britain's economy. The economy continues to lose money, problems associated with Brexit and the uncertainty surrounding the trade deal with the European Union continue to negatively affect the business climate and the desire of entrepreneurs to invest. Moreover, certain companies are leaving the UK, some are cutting production on its territory, some are moving their financial centers outside of Great Britain. Of course, all this negatively affects the economy.

The next indicator is industrial production. Here things are even worse than with GDP. In annual terms, industrial production has been declining for a year and a half almost every month. Tomorrow it is expected that this indicator will lose its regular 0.8% in annual terms, and will add 0.3% in monthly terms. It is clear that even if the annual indicator is slightly better than expected, it is still unlikely to get out of the negative zone. Thus, both main indicators of tomorrow should significantly exceed forecast values in order to trigger purchases of the British pound.

We would also like to draw the attention of traders to the indicator of the volume of commercial investments, which, although not as important as the first two indicators, still reflects the essence of what is happening. Judging by the data for the last 12 months, investment volumes are also more often declining than growing. For tomorrow, the forecast is -1.3% in the fourth quarter on an annualized basis. And what do we have in the end? The three most significant indicators for the UK economy over the past year and a half have only been doing so, which are declining. For tomorrow, all three indicators have negative forecasts. What growth of the British pound in the long run can be discussed with such macroeconomic statistics? We are still wondering why the Bank of England didn't soften monetary policy at the last meeting and where did it see "economic recovery after the December elections"? We notice only an even greater reduction in key indicators. And again, it is worth noting that all this happens before the official breakdown of all ties between London and Brussels, which is scheduled for December 31, 2020. That is, in fact, Brexit has not even begun. Now only preparations are underway for him.

From a technical point of view, all indicators show a downward movement, except for the higher linear regression channel. Thus, the overall trading strategy remains the same - downward trading, especially since there are not even any corrections now.

The average volatility of the pound/dollar pair has dropped to 91 points over the past five days, and the volatility illustration clearly shows that in the last 6 days it has been reduced. According to the current level of volatility, the working channel on February 11 will be limited by the levels of 1.2821 and 1.3003. The resumption of the downward movement would be very logical on Tuesday, given the fundamental background. A turn of the Heiken Ashi indicator down will indicate the completion of a round of corrective movement.

Nearest support levels:
S1 - 1.2878
S2 - 1.2817
S3 - 1.2756

The nearest resistance levels:
R1 - 1.2939
R2 - 1,3000
R3 - 1.3062

Trading recommendations:
GBP/USD is adjusted.
Thus, traders are now advised to wait until the correction is completed and resume selling the pound with goals of 1.2878 and 1.2821. It is recommended to consider purchases of the British currency after the price is consolidated above the moving average line with the first objectives of 1.3062 and 1.3123.

In addition to the technical picture, fundamental data and the time of their release should also be taken into account.
Explanation of illustrations:
The highest linear regression channel is the blue unidirectional lines.
The smallest linear channel is the purple unidirectional lines.
CCI - blue line in the indicator regression window.
Moving average (20; smoothed) - a blue line on the price chart.
Murray levels - multi-colored horizontal stripes.
Heiken Ashi is an indicator that colors bars in blue or purple.
Possible price movements:
Red and green arrows.

*The market analysis posted here is meant to increase your awareness, but not to give instructions to make a trade.

Analysis are provided by InstaForex
 
Comprehensive analysis of movement options of #USDX vs AUD/USD vs USD/CAD vs NZD/USD (H4) on February 12

Minuette (H4)
Let's consider what will happen to commodity currency instruments from February 12, 2020. So, here's a comprehensive analysis of the development options for the movement #USDX vs AUD / USD vs USD / CAD vs NZD / USD.

US dollar index
The movement of the #USDX dollar index from February 12, 2020 will be determined by developing and the direction of breakdown of the boundaries of the equilibrium zone (98.63 - 98.83 - 99.05) of the Minuette operational scale forks. We look at the movement markings inside this zone on the animated chart.

In case of breakdown of the lower boundary of ISL61.8 (support level of 98.63) of the equilibrium zone of the Minuette operational scale forks, it will lead to the development of the downward movement of the dollar index and be directed to the boundaries of the equilibrium zone (98.20 - 97.92 - 97.64) of the Minuette operational scale forks.

On the contrary, If the upper boundary of ISL61.8 (resistance level of 98.40) of the equilibrium zone of the Minuette operational scale forks and the final line FSL (resistance level of 99.12) of the Minuette operational scale forks are broken down, the upward movement #USDX can continue to the warning line UWL38.2 (99.60) of the Minuette operational scale forks and FSL Minuette end line (99.75). The markup of #USDX movement options from February 12, 2020 is shown on the animated chart

Australian dollar vs US dollar

The development and direction of the breakdown of the boundaries of 1/2 Median Line channel (0.6699 - 0.6715 - 0.6731) of the Minuette operational scale forks will determine the development of the movement of the Australian dollar AUD / USD from February 12, 2020. The marking the development of the above levels are shown on the animated chart.

The breakdown of the upper boundary of the 1/2 Median Line Minuette channel - resistance level of 0.6731 will lead to the Australian dollar reaching the equilibrium zone (0.6739 - 0.6764 - 0.6787) of the Minuette operational scale forks with the prospect of further development of the AUD / USD movement in the 1/2 Median Line channel (0.6780 - 0.6830 - 0.9875) of the Minuette operational scale forks.

A sequential breakdown of the lower boundary of the 1/2 Median Line channel of the Minuette operational scale forks - support level of 0.6699 and the 1/2 Median Line Minuette 0.6690 will determine the continuation of the development of the downward movement of the Australian dollar towards the goals:
- the initial SSL Minuette line (0.6655);
- control line LTL Minuette (0.6644);
- lower boundary ISL61.8 (0.6625) equilibrium zone of the Minuette operational scale forks;
with the prospect of reaching warning lines - LWL38.2 (0.6615) and LWL61.8 (0.6590) of the Minuette operational scale forks.
We look at the layout of the AUD / USD movement options from February 12, 2020 on the animated chart.

US dollar vs Canadian dollar

The development of the movement of the Canadian dollar USD / CAD from February 12, 2020 will continue to be determined by developing the boundaries of the equilibrium zone (1.3225 - 1.3276 -1.3333) of the Minuette operational scale forks. We look at the movement markings inside this zone on the animated chart.

The breakdown of the lower boundary of ISL38.2 (support level of 1.3225) of the equilibrium zone of the Minuette operational scale forks will continue the development of the downward movement of the Canadian dollar towards the goals:
- lower boundary of ISL61.8 (1.3200) equilibrium zones of the Minuette operational scale forks;
- final Schiff Line Minuette (1.3185);
with the prospect of reaching the final line of the FSL Minuette (1.3115).
On the other hand, a combined breakdown of the upper boundary of the ISL61.8 (resistance level of 1.3333) equilibrium zone of the Minuette operational scale forks and the control line UTL Minuette (1.3345) will make the achievement of USD / CAD warning lines - UWL23.6 (1.3365) - UWL38.2 (1.3390) - UWL61.8 (1.3410) and UWL100.0 (1.3455) of the Minuette operational scale forks, relevant.
We look at the markup of USD / CAD movement options from February 12, 2020 on the animated chart.

New Zealand dollar vs US dollar

The development of the movement of the New Zealand dollar NZD / USD from February 12, 2020 will depend on the development and direction of the breakdown of the range :

resistance level of 0.6390 (the lower boundary of the 1/2 Median Line channel of the Minuette operational scale forks);
support level of 0.6370 (control line LTL of the Minuette operational scale forks).

In case of breakdown of the resistance level of 0.6390, the NZD / USD movement will continue in the 1/2 Median Line Minuette channel (0.6390 - 0.6460 - 0.6525), and if the upper boundary (0.6525) of this channel is broken, the price of the instrument will continue to move in the equilibrium zone (0.6525 - 0.6575 - 0.6622) of the Minuette operational scale forks.

Alternatively, in case that the breakdown of the support level of 0.6420 takes place on the control line of the LTL of the Minuette operational scale forks, then it will be relevant to reach the New Zealand dollar reaching the boundaries of the equilibrium zone (0.6350 - 0.6255 - 0.6155) of the Minuette operational scale forks.

We look at the layout of the NZD / USD movement options from February 12, 2020 on the animated chart.

The review is made without taking into account the news background. Thus, the opening of trading sessions of major financial centers does not serve as a guide to action (placing orders "sell" or "buy").

The formula for calculating the dollar index:

USDX = 50.14348112 * USDEUR0.576 * USDJPY0.136 * USDGBP0.119 * USDCAD0.091 * USDSEK0.042 * USDCHF0.036.

where the power coefficients correspond to the weights of the currencies in the basket:

Euro - 57.6%;
Yen - 13.6%;
Pound Sterling - 11.9%;
Canadian dollar - 9.1%;
Swedish krona - 4.2%;
Swiss franc - 3.6%.

The first coefficient in the formula leads the index to 100 at the starting date - March 1973, when the main currencies began to be freely quoted relative to each other.

Analysis are provided by InstaForex
 
Forecast for EUR/USD on February 13, 2020

EUR/USD
Yesterday's publication of data on industrial production in the eurozone was worse than expected - the December decline was-2.1% versus the expected -1.8%. In Europe, they talked about a potentially even greater economic failure due to the epidemic in China. But China itself predicts that the epidemic will decline in April. The euro lost 40 points on Wednesday. The 1.0880 target was fulfilled, there was a consolidation under the lower TF. The following goals are determined by Fibonacci levels: 161.8% - 1.0840, 200.0% - 1.0745.

A convergence is outlined on the four-hour chart on the Marlin Oscillator, this is a sign of a slight correction before a further decline. Consolidation will likely take place before the level of 1.0905.

*The market analysis posted here is meant to increase your awareness, but not to give instructions to make a trade.

Analysis are provided by InstaForex
 
EURUSD: euro not pleased with the European Commission's future outlook for eurozone inflation. US inflation report will return the market to its place

The European currency was not very happy with the fact that consumer prices in Germany fell again in January, having justified all the forecasts of analysts, who put on another decline. The main decline in prices was due to a sharp drop in demand for tourism services, and there are reasons for this. According to the statistics agency Destatis, the final CPI of Germany in January 2020 fell by 0.6% compared to December and increased by 1.7% compared to the same period of the previous year. The data fully coincided with the expectations of economists. As for inflation harmonized by EU standards, the index decreased by 0.8% in January compared to December and increased by 1.6% compared to January 2019.

As I noted above, the main reason is the sharp decline in prices for travel packages that occurred due to the outbreak of coronavirus in China. After a series of bad indicators released this and that week on the eurozone countries, many economists no longer consider future forecasts for Europe to be too optimistic. However, today, in the first half of the day, after a breakdown of the year's low in the region of 1.0865, the European Commission kept a report from a larger fall of the euro, in which a number of experts expected to see revised forecasts for economic growth and inflation.

Let me remind you that the European Commission's previous forecast was presented in November 2019.

So, in today's report, the European Commission continues to forecast eurozone GDP growth in 2020 at 1.2% and at a similar level in 2021. But the inflation forecast, on the contrary, was revised for the better. Now economists expect that inflation in the eurozone will be at 1.3% in 2020 against the previous forecast of 1.2%. For 2021, growth is expected at 1.4% against the previous forecast of 1.3%.

So far, the main concern that will negatively affect the eurozone economy is coronavirus, which represents a new bearish risk. There is also a fairly high degree of uncertainty surrounding US trade policy, which is an obstacle to improving sentiment. And if the trade agreement between the US and China has somewhat reduced the bearish risks, what will happen when the White House again raises the issue of duties with the eurozone is still a question.

The European Commission expects that economic growth will remain stable, and all emphasis is placed on domestic demand, while easing fiscal policies may support the economy in the future. The report also called for eurozone countries to pursue structural reforms aimed at boosting economic growth.

As for the technical picture of the EURUSD pair, buyers of risky assets continue to actively fight for the level of 1.0865, having missed that on inflation data in the US, one can only hope for lows in the areas of 1.0840 and 1.0800. If the scenario of profit taking on short positions by large players justifies itself after the data, then the upward correction will be limited by the first intermediate resistance level of 1.0890, but larger highs are seen in the areas of 1.0925 and 1.0950.

*The market analysis posted here is meant to increase your awareness, but not to give instructions to make a trade.

Analysis are provided by InstaForex
 
GBP/USD. Preview of the new week. Pound to closely monitor inflation and business activity in the industry

24-hour timeframe

As I noted above, the main reason is the sharp decline in prices for travel packages that occurred due to the outbreak of coronavirus in China. After a series of bad indicators released this and that week on the eurozone countries, many economists no longer consider future forecasts for Europe to be too optimistic. However, today, in the first half of the day, after a breakdown of the year's low in the region of 1.0865, the European Commission kept a report from a larger fall of the euro, in which a number of experts expected to see revised forecasts for economic growth and inflation.

The British pound began to form a new downward trend, but a turn up and a round of upward correction began this trading week against the current weakest downward trend. Bollinger Bands are directed down, which so far retains the likelihood of a resumption of a downward trend. Also, the pound/dollar pair has not yet been able to cross the Kijun-sen line on the 24-hour chart, although it is very close to it. As we have already said, this week traders reacted not to macroeconomic statistics, but to political news from the British Parliament. And we believe that the pound once again shows growth when there is no reason at all for this. Over the past two years, this situation has been repeated regularly, the pound regularly rises in price on rumors that are not confirmed, on expectations, on various kinds of political messages. But macroeconomic statistics are just regularly ignored, as it was this week. The upcoming week will be much more interesting for the GBP/USD currency pair than for the EUR / USD pair, since there will be a sufficient amount of important data from Great Britain.

Monday will be completely empty in terms of macroeconomic statistics. There is absolutely nothing to pay attention to. President's Day will be celebrated in the United States on Monday. Therefore, you can proceed to Tuesday. On this day, the UK will publish average wage for December with and without bonuses, the unemployment rate for December, as well as the number of applications for unemployment benefits. No major changes in these indicators are expected. The unemployment rate is likely to remain at a fairly low level of 3.8%, the number of new applications for unemployment benefits will amount to 22,600, and the growth rate of wages can only slightly slow down. Thus, everything will depend on how much the real values of the indicators differ from the predicted ones.

A much more important consumer price index in the UK will be published on Wednesday, which, according to experts, could accelerate from 1.3% y/y to values ranging from 1.4% - 1.6% y/y. However, in monthly terms, inflation is likely to slow down by 0.5% - 0.6%, which, in fact, eliminates almost any positive effect from the annual value. Recall that the annual value is calculated relative to the same month last year. Thus, it turns out that the annual value can be at least +5%, but if negative inflation is recorded in monthly terms, this will mean that it will continue to slow down, and in the case of Great Britain, deflation can already be observed in monthly terms.

Great Britain will release retail sales reports for January, as well as a CBI report on changes in industrial orders. It is expected that the first indicator will show an increase of 0.4% in annual terms and in monthly terms. This is a good increase for the monthly, while it is very weak for the annual. The second industrial order indicator, presented by the Confederation of British Industrialists, is expected to remain in the negative zone, since the British industry continues to experience serious problems.

Britain is set to publish indices of business activity in the fields of services and production in the last trading week of the next week. In recent months, the index in the manufacturing sector has risen and returned to the area of 50.0 and higher, however it may again fall to the area below the key level of 50 by the end of February. According to forecasts, this indicator will decrease to the value 49.6 in February. As for the service sector, everything is more stable and positive here - forecasts for February are 53.2 - 53.4 with the previous value of 53.9. As you can see, a decline is expected everywhere.

In general, we believe that the British currency will have no supporting macroeconomic factors next week. Having studied all the macroeconomic reports, we came to the conclusion that most of them could fail again. Of course, special attention should be paid to inflation, if it accelerates, this can cause a wave of purchases of the British currency, but in general we do not see the prerequisites for the UK economy to accelerate and macroeconomic indicators to recover. From time to time, individual indicators grow (for example, the index of business activity in industry), but this looks like a correction, after which a new decline will inevitably follow. Thus, the Bank of England has many questions about the current state of the British economy, as well as to monetary policy, which, in our opinion, should have already been softened.

Trading recommendations:
The pound/dollar pair started an upward correction on the 24-hour timeframe. Thus, at the moment, for the 24-hour timeframe, it is recommended that you aim for 1.2838 and 1.2724 for the pound, if the bulls fail to overcome the Kijun-sen critical line. Shorts are still more relevant on the 4-hour timeframe, but there you should now wait until a dead cross forms before resuming to trade down.

Explanation of the illustration:
Ichimoku indicator:
Tenkan-sen is the red line.
Kijun-sen is the blue line.
Senkou Span A - light brown dotted line.
Senkou Span B - light purple dashed line.
Chikou Span - green line.
Bollinger Bands Indicator:
3 yellow lines.
MACD indicator:
line and bar graph with white bars in the indicators window.

*The market analysis posted here is meant to increase your awareness, but not to give instructions to make a trade.

Analysis are provided by InstaForex
 
Forecast for AUD/USD on February 18, 2020

AUD/USD
A minutes was issued from the last RBA meeting on monetary policy this morning. Committee members agreed that the economy will slightly decline in the medium term due to drought and the outbreak of SARS in China. By the end of the year, financial politicians are waiting for the economy to grow, pending the growth of investment in fixed assets. This made market participants doubt such optimism, since the IMF expects the global economy to weaken by the end of the year. It was also mentioned that the committee was considering options for lowering the rate, but decided to postpone and leave room for maneuver in the event of a worsening economic situation. In general, the rates are supposed to be kept at a low level for quite a long time.

This release, of course, did not contribute in any way to purchases of the Australian dollar and the aussie lost more than 20 points in the Asian session. The Australian dollar's technical reversal occurred from the Fibonacci level of 161.8% yesterday. The target is 0.6624 in terms of the Fibonacci level of 223.6% and the support of the price channel line is open. Perhaps there will be a breakout of the level, and the price will reach 0.6595 at the Fibonacci level of 238.2%. After this movement, a correction is likely.

On the H4 chart, the price crossed both indicator support lines - the balance line (red) and the MACD line (blue). Marlin is declining in the negative trend zone. The Australian dollar will continue to decline.

*The market analysis posted here is meant to increase your awareness, but not to give instructions to make a trade.

Analysis are provided by InstaForex
 
What are the major institutions trading? | Weekly Commitment of Traders (COT) report (17/2 to 21/2)

On the H4 chart, the price crossed both indicator support lines - the balance line (red) and the MACD line (blue). Marlin is declining in the negative trend zone. The Australian dollar will continue to decline.

Our strongest currency is the US Dollar with a bullish strength factor of 1.73 and with institutions adding more long contracts.

Our weakest currency is the New Zealand Dollar with a bearish strength factor 1.43 and with a net bearish positions of 2,287 meaning that there are a lot of institutions adding on to their short positions (2,983) while at the same time, reducing their long positions (-696).

With a weak NZD and a strong USD, it would be good to look for short NZD/USD positions for this week.

Also worth noting are the weak Japanese Yen, Australian Dollar and the strong Euro, Pound and Canadian dollar.

Analysis are provided by InstaForex
 
What games do you play? Prefer on the phone or on a computer? I've been sticking with mr bet casino no deposit bonus , like slot machines. My wife says I'm addicted, but I'm not always in the game and not losing, always on the plus side, I don't pull money from home.
 
Forecast for EUR/USD on February 20, 2020

EUR/USD
The euro gained 13 points on Wednesday as part of a moderate expected correction after the previous three-figure fall. The growth could have been greater, but this was hindered by the fall of the British pound and the Japanese yen and the report on the eurozone balance of payments for December, which showed a balance of 32.6 billion euros against expectations of 34.5 billion. Data on the laying of new homes in the US for January showed a small decrease: 1.57 million against 1.63 million a month earlier, but the issued building permits increased from 1.42 million to 1.56 million, showing the highest figure since January 2007. Published minutes from the last FOMC Fed meeting showed nothing interesting.

On the daily chart, the signal line of the Marlin Oscillator is pointing upward, it is possible to continue the correction to the Fibonacci level of 161.8% at the price of 1.0840. The main objectives of declining 1.0745 and 1.0650/80 are maintained.

On the four-hour chart, the double convergence according to Marlin retains its potential effect, which may result in continued price growth, but the signal line of the oscillator stopped at the boundary with the territory of growth. Its withdrawal under its own support (the turquoise line) neutralizes the influence of convergence. This will happen if the price goes below yesterday's low.

Analysis are provided by InstaForex
 
AUD/USD. "There would be a reason, but there will be a seller": aussie slumps to multi-year lows

The Australian dollar today completely lost ground: after the release of conflicting data on the labor market in Australia, the AUD/USD pair fell while updating multi-year lows. The last time the price was at such lows was 11 years ago - back in 2009. It should be noted right away that such price dynamics are caused not only by a weak macroeconomic report - first of all, traders are concerned about the prospects of the RBA monetary policy. Published on Tuesday, the minutes of the Australian central bank's last meeting fueled speculation on this subject, while today's release has become a kind of "last straw".

Let me remind you that at the end of the first meeting of the RBA this year, the regulator voiced a signal that it does not exclude further easing of monetary policy. The minutes of this meeting, published the day before yesterday, somewhat eased concern about the dovish intentions of the central bank. The Australian regulator acknowledged that the risks of further easing monetary policy parameters "outweigh its benefits." That is, on the one hand, the Reserve Bank of Australia is ready to resort to decisive action in response to the slowdown of the national economy and the economy of China. On the other hand, members of the central bank stated the need to "balance the risks that inevitably involve even lower interest rates."

The market interpreted this wording in favor of the Australian currency - they say, the central bank will resort to lower rates only in extraordinary situations. That is why the rather dovish minutes exerted a slight downward pressure on the pair.

Nevertheless, the minutes of the February meeting laid the foundation for strong volatility for the pair in the future. The fact is that the RBA members "linked" the issue of monetary easing with the dynamics of Australia's key macroeconomic indicators. According to them, the need to reduce rates depends on progress or regression in achieving the central bank's goals for inflation and employment. This suggests that the data on the growth of the Australian labor market and the main indicators of inflation are now viewed by the market through the prism of further prospects for the RBA monetary policy.

Actually, for this reason, the aussie slumped in almost all of the pairs today (not only against the US dollar). Published data reinforced rumors that the regulator will lower rates this spring. In particular, according to the Bank of Australia, the RBA members will announce this step at the March meeting, and they will reduce the interest rate by 25 basis points in April .

In my opinion, the regulator will take a wait-and-see attitude approximately until the summer. Firstly, by this time it will become clear how seriously the coronavirus slowed down the Chinese economy (and, as a consequence, the world economy). Secondly, the Australian regulator in six months will be able to see a more complete picture regarding the dynamics of indicators of the national economy.

In fairness, it is worth saying that the latest Australian labor market data was not catastrophic. The market focused on rising unemployment to 5.3% - this fact served as a kind of red flag for traders who panicked over the rate cut this spring. Although the remaining components came out better than expected. For example, the number of employees in January increased by 13 thousand, while experts expected growth by only 10 thousand. Another positive point of today's report is the growth of full employment. This component jumped to 46 thousand. On the contrary, part-time employment declined by 32 thousand. This trend can have a positive effect on the dynamics of wage growth, as regular positions, as a rule, offer a higher level of wages and a higher level of social security. The share of the able-bodied population was 66.1% (with a forecast of growth to 66.0%). This fact, in theory, was supposed to partially offset the negative effect of rising unemployment.

Thus, the Australian today fell under the hot hand of traders who were ready to sell the aussie since Tuesday, when the minutes of the last RBA meeting were published. Today, the market has gotten a chance to fulfill its intentions: an increase in unemployment has become a signal that the regulator will nevertheless lower the rate in the foreseeable future. In my opinion, this conclusion seems premature, but the principle of sell by rumors still works. In addition, the general hegemony of the US dollar and the ongoing panic over the spread of coronavirus reinforces the pair's downward momentum. Bears overcame almost all levels of support, heading towards the 65th figure. If the fundamental picture for the pair does not change, then sellers will test the most powerful support level in the near future, which is located at 0.6570 and corresponds to the lower line of the Bollinger Bands indicator on the monthly chart.

Analysis are provided by InstaForex
 
Technical analysis of GBP/USD for 24/02/2020

Technical Market Outlook:

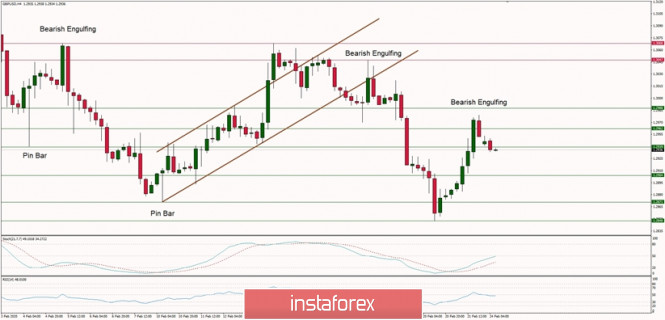
The GBP/USD pair rallied through all the near technical resistance levels located at 1.2871, 1.2904, 1.2939 and 1.2962, but eventually, bulls did not make it through the technical resistance located at the level of 1.2988. The market had made a Bearish Engulfing candlestick pattern around this level and the bears took control over the market. Currently, the price is coming off the hight and traders around the level of 1.2939. The larger timeframe trend remains up, but the recent breakout from the consolidation zone is a signal, that the uptrend might be reversed soon.

Weekly Pivot Points:

WR3 - 1.3255

WR2 - 1.3152

WR1 - 1.3043

Weekly Pivot - 1.2942

WS1 - 1.2840

WS2 - 1.2740

WS3 - 1.2640

Trading recommendations:

The best strategy for current market conditions is to trade with the larger timeframe trend, which is up, so all downward market moves will be treated as local corrections in the uptrend. In order to reverse the trend from up to down in the longer term, the key level for bulls is seen at 1.2756 and it must be clearly violated. The key long-term technical support is seen at the level of 1.2231 - 1.2224 and the key long-term technical resistance is located at the level of 1.3512.


analytics5e536c3806bc0.jpg


*The market analysis posted here is meant to increase your awareness, but not to give instructions to make a trade.
 
Trading plan for EUR / USD and GBP / USD on 02.25.2020

What is happening in the currency market raises more and more questions especially if you look at the behavior of the single European currency and the pound, which behave in completely different ways. And it would be nice if this happened under the influence of certain macroeconomic data or political events both in the European Union and Great Britain. So no, nothing of the kind happened yesterday.

At the same time, as usual, the market completely ignored the rather secondary data on Germany. We are talking about the IFO indices, which remained completely without any attention. At the same time, the business optimism index increased from 96.0 to 96.1, but the current situation assessment indicator declined from 99.2 to 98.9. In turn, the expectations index rose from 92.9 to 93.4. At the same time, it is surprising how expectations can grow if the current situation worsens. So, on the whole, the data can be characterized as multi-directional, and no conclusions can be drawn from them. Moreover, the lack of reaction is also associated with this.

IFO Business Optimism Index (Germany):

On the other hand, the single European currency began to grow actively from the very opening of the American trading session, although at the same time, I placed French government securities, the yield on which went down. In particular, the yield on 6-month bonds decreased from -0.587% to -0.589%, while 12-month bills from -0.582% to -0.591%. Only on 3-month bills was an increase in profitability recorded from -0.596% to -0.587%. And yes, this is not a mistake. The yield on them is negative for all. That is, investors will receive less than they invested. And in theory, this situation should scare investors, but the single European currency was growing.

And against the background of all this, the subsequent behavior of the dollar at the time of placement of already US government debt securities, looks extremely untypical. It's just right. The profitability went down and the dollar became cheaper. But then again, only in relation to the single European currency. So, the yield on 3-month bills decreased from 1.545% to 1.505%, while on 6-month bills from 1.51% to 1.44%. And here is where the behavior of the dollar is completely logical and correct. However, another thing is surprising, because the yield on government loans should go down if the market expects a decrease in the refinancing rate of the Federal Reserve. But the fact is that American macroeconomic statistics clearly indicate that Jerome Powell just right to think about the possibility of raising this refinancing rate. So questions are raised by the dynamics of the yield on government debt securities, since it is clearly moving in the wrong direction. Although this may be due to just growing demand associated with a clear deterioration in the economic situation in Europe, while the US economy is doing quite well.

The market continues to demonstrate its indifference to European macroeconomic data since early in the morning. Although in Germany, Europe's largest economy, the fourth quarter final GDP data showed that economic growth did not slow down from 0.6% to 0.4%, as preliminary data showed, but to 0.3%. In other words, the German economy is moving toward recession even faster, but the market does not seem to notice it. Just as he did not notice the slowdown in the decline in producer prices in Spain from -1.9% to -0.8%. Although everything is clear here, since the Spanish macroeconomic data are in any case not as important as the German ones.

GDP growth rate (Germany):

However, today is seriously different from yesterday, as the United States publishes important macroeconomic data. Well, the market reacts extremely sensitive to American statistics. So, the S & P / CaseShiller data should show an acceleration in the growth rate of housing prices from 2.6% to 2.8%. Given the fact that rising house prices is a leading inflation indicator, then inflation will continue to rise. It turns out that American statistics may well be the reason for the resumption of the strengthening of the dollar.

S & P / CaseShiller (United States) Housing Price Index:

The euro / dollar currency pair which is in the correction phase returned to the area of 1.0850, where the quote slowed down and formed a range of 1.0840 / 1.0870. It is likely to assume that the fluctuation in the given framework will continue in the market, where in case the price is fixed lower than 1.0830, a signal of working off the level of 1.0850 will be received and, as a fact, the downward trend will be restored.

The pound / dollar currency pair is within the correctional course of the past week, where the quote tends to a maximum of 1.2976. It is likely to assume that the local upward interest will soon change, and the quote will return to the values of 1.2900 ---> 1.2885 again.

*The market analysis posted here is meant to increase your awareness, but not to give instructions to make a trade.

Analysis are provided by InstaForex
 
Forecast for EUR/USD on February 27, 2020

EUR/USD
The euro once again tried to compete with the resistance of the Fibonacci level of 138.2% (1.0898) on Wednesday, the trading volume was high, it is very likely that investors again accumulated short positions. The signal line of the Marlin oscillator reached the boundary of the growth territory. The degree of probability of a reversal from this boundary will be considered on a smaller scale chart.

At H4, the oscillator signal line exited down from the wedge and returned to it. In general, this is still a signal for a price reversal. Confirmation of a reversal will be when the price leaves yesterday's low of 1.0855. The immediate goal of the euro 1.0813 is to support the MACD line. Next, we expect the euro at a quote of 1.0745 - at the Fibonacci level of 200.0% (daily).

But the euro is still growing. The growth limit may be the Fibonacci level of 123.6% at the price of 1.0933.

*The market analysis posted here is meant to increase your awareness, but not to give instructions to make a trade.

Analysis are provided by InstaForex
 
Forecast for EUR/USD on February 28, 2020

EUR/USD
The euro showed an abnormal growth of 120 points on Thursday amid moderate (canadian dollar) or even indistinct (Australian dollar) development in other leading currencies.. The reason for this was the widespread risk aversion and the curtailment of European carry trade transactions. The US stock market (S&P 500) fell 4.42%, in one week the decline blocked the previous four-month growth. The market likelihood (in accordance with futures on federal funds) of the Fed's rate cut in March in one day increased from 44.3% to 97.4%, even for April, another cut is 73.1% compared to 27.5% the day before. At a time when the epidemic of the coronavirus began to subside, a storm came to the markets. On the other hand, this is the best time to blow out market bubbles and remove small players from the market. Major players left the market last year. Euro trading volumes were the highest yesterday in the last 5.5 months. The lion's share did not fall on purchases, but on closing stop losses above 1.09. The euro corrected 50% of the entire decline on December 31-March 20. Now you can turn down. The fact is that if investors really consider the collapse to be the beginning of a new global crisis, whether they want it or not, the world will buy dollars even when rates are lowered, but carry trade deals, according to experience, are closed very quickly.

The euro reached a low of January 2020 and the resistance of the embedded line of the price channel on the daily chart. Growth was stopped by the red indicator line of balance, which from a purely technical point of view indicates that the downward mood will continue. The MACD line is also higher than the price. The Marlin has risen, but shows an intention to turn down.

The situation is completely upward on the four-hour chart. The Marlin oscillator in the overbought zone. Taking into account yesterday's volumes, we can expect some price delay in the area of the reached high, investors will need several days to make new decisions. A signal for the resumption of sales will be when the price leaves the under the MACD line, approximately, around 1.0890-1.0900, that is, from the place where there were recent stop losses.

Analysis are provided by InstaForex
 
Forecast for EUR/USD on March 2, 2020

EUR/USD

Good data on the US came out on Friday, which put pressure on most currencies, but the euro ended the day higher after a bit of confusion. Personal incomes of consumers increased by 0.6% in January, expenses increased by 0.2%, business activity in the manufacturing sector of the Chicago region in February amounted to 49.0 points against 42.9 a month earlier. Also, the commodity trade balance improved from -68.7 billion to -65.5 billion in January.

Today the final PMI estimates for February will come out in the eurozone (expectations unchanged), while the US ISM Manufacturing PMI is projected to decrease from 50.9 to 50.5, which may extend the euro's growth amid expectations of a Fed rate cut on the 18th. Markets lay a 94.9% probability of a rate cut immediately by 0.50% to 1.25% and another decrease by 0.25% at a meeting on April 29th. Looking ahead, we note that lowering rates will have a short-term effect on the dollar, the development of the crisis will nevertheless return market sentiment to the purchase of safe haven currency, as it was during the 2008 crisis.

analytics5e5c956742428.png


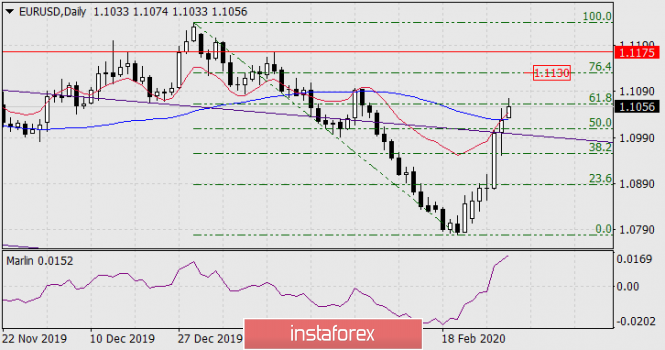
On the daily chart, the price went above both indicator lines - above the red balance line, which shifts the price balance towards growth, and above the MACD line, which indicates a medium-term direction to growth. The immediate goal is the correction level of 76.4% at the price of 1.1130, overcoming the level opens the second goal of 1.1175 - a strong record level (a high on January 16, December 17, etc.).

The daily Marlin oscillator is close to the overbought zone, it has significantly pulled down the growth rate. We are waiting for the euro's next reaction. Labor indicators on Friday will become very important for understanding the Fed's intentions on the rate - good data are unlikely to push the central bank to double the rate cut, and one decrease by 0.25% is already actively included in the price.

analytics5e5c957cea99f.png


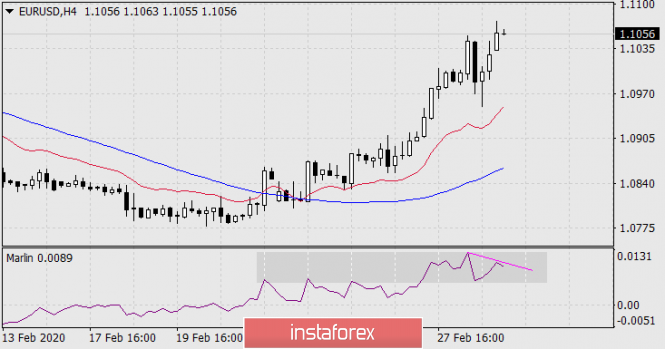
The situation is completely upward on the four-hour chart, only the Marlin oscillator forms a kind of consolidation in front of the overbought zone, and a small divergence, which indicates an imminent slowdown in price growth with the likelihood of converting into a short-lived horizontal trend (1-2 days).

*The market analysis posted here is meant to increase your awareness, but not to give instructions to make a trade.
 
Forecast for GBP/USD on March 3, 2020

GBP/USD
The quote of the British pound remained at the Fibonacci level of 123.6% for two days. Investors are waiting for news from the negotiations of the British delegation with European politicians. The current stage of negotiations will end on Thursday. Consolidating the price under yesterday's low opens the target at the Fibonacci level of 138.2% at the price of 1.2670. The second target is 161.8% at 1.2530. It is also possible to continue trading in the range, then the price can once again be marked at the Fibonacci level of 110.0% (1.2844).

On the four-hour chart, the signal line of the Marlin oscillator is moving up, which may be a warning of another local increase before the medium-term decrease (potential, expected). Here, the resistance is the MACD line, which moves to the Fibonacci level of 110.0%. The Marlin oscillator by this time will reach the boundary with the growth territory and will turn down from it.

*The market analysis posted here is meant to increase your awareness, but not to give instructions to make a trade.

Analysis are provided by InstaForex
 
Forecast for GBP/USD on March 4, 2020

GBP/USD

Yesterday, the growth of the British pound was stopped at the Fibonacci level of 110.0% (1.2843). At the moment, technical indicators do not show any proactive signals of continued growth or a price reversal. The same situation of uncertainty in the political sphere, the results of trade talks between the UK and the EU should become known tomorrow.

On the four-hour chart, the signal line of the Marlin oscillator touched the boundary with the growth territory. There may be a downward turn from this line, but there may be continued growth.

In general, the situation is going down on both scales - the price is lower than the indicator lines, there are no warning reversal patterns. The pound may rise after the price overcomes the Fibonacci level of 110.0% (1.2904), a return to decline is likely after leaving the level of 123.6% at the price of 1.2760. We are waiting for news from Brussels where trade negotiations take place.

Analysis are provided by InstaForex
 
Forecast for EUR/USD on March 5, 2020

EUR/USD
The EUR/USD quote continues to stay at the Fibonacci level of 76.4% on the daily scale chart, in the area of Monday's close. Trading volumes were high, indicating closing positions from purchases since February 21. The euro is unfolding.

The first goal 1.1035 is to support the MACD line on a daily chart. The second target, 1.0990, is an embedded price channel line, overcoming of which, in turn, opens the way to a medium-term decline in the euro. Investors are laying a 90% chance that the ECB will lower the deposit rate from the current -0.50% to -0.60% at its meeting on March 12th.

*The market analysis posted here is meant to increase your awareness, but not to give instructions to make a trade.

Analysis are provided by InstaForex
 
Forecast for EUR/USD on March 6, 2020

EUR/USD
The expected euro reversal is delayed. Markets are laying the probability of a threefold Fed rate cut by April, that is, from the current of 1.25% to 0.50%. Investors clearly suffered, because on Wednesday the head of the St. Petersburg Federal Reserve Bank of St. James James Bullard spoke and said bluntly that the markets were mistaken, laying even a quarter point rate hike on March 18, since an emergency rate cut on Tuesday was a preventive measure, you need to get at least some information on the impact of coronavirus on the US economy.

Trading volumes sharply fell, but still exceeded the top five-month volumes. This is excessive volumes for yesterday's growth of the euro by 100 points, which means that strategic investors still continued to close positions on the purchase of middle-hand players.

The price stopped at the Fibonacci level of 100.0% - at the top of December 31. The Marlin oscillator began to turn around from overbought zone. Today, US employment data for February will be released. The consensus forecast for unemployment is the previous 3.6%, but there are estimates even lower at 3.5%. Outside the agricultural sector, an increase of 175 thousand new jobs is expected. This news is likely to become a turning point for the entire market.

The first goal 1.1035 is to support the MACD line on a daily chart. The second target, 1.0990, is an embedded price channel line, overcoming of which, in turn, opens the way to a medium-term decline in the euro. Investors are laying a 90% chance that the ECB will lower the deposit rate from the current -0.50% to -0.60% at its meeting on March 12th.

On the four-hour chart according to Marlin, divergence is forming. The purpose of the euro decline is the Fibonacci level of 61.8% (in fact 38.2% of the growth since February 20), the MACD line is striving for this level both on the daily chart and on the four-hour chart.

*The market analysis posted here is meant to increase your awareness, but not to give instructions to make a trade.

Analysis are provided by InstaForex
 
GBP/USD. Trumps of the pound and the dollar's hopeless prospects

EUR/USD
The pound ended the trading week on a major note: paired with the dollar, the pound was able to return to the area of the 30th figure, after falling to around 1.2725 at the end of February. Such dynamics is explained not only by the weakness of the US currency. The buyers of GBP/USD gave a rather positive assessment of the first results of the negotiation process between Brussels and London, although representatives of the parties announced serious disagreements that could not be overcome yet. Nevertheless, the negotiators also voiced encouraging theses - it was on them that the market focused its attention.

In particular, the head of the European delegation Michel Barnier expressed confidence that they will be able to negotiate with the UK, despite the "very, very serious disagreements." He noted that the parties initially had completely different positions on key issues, so these differences in views were not a surprise to anyone. Nevertheless, he was optimistic about the prospects for negotiations.

The market seized on this phrase, although it is actually unclear how the parties plan to find a common denominator. Barnier named four points on which there are serious differences. According to him, if no compromise is reached on these issues, an agreement is unlikely to be signed.

First, it is about maintaining European standards that would guarantee equal trading opportunities. At the moment, London does not want to oblige itself to comply with these standards, and most importantly, it is opposed to the creation of appropriate mechanisms that could monitor the situation and record "unjustified commercial advantages".

Secondly, the British refuse to recognize not only the jurisdiction of the European Court of Justice, but also the European Convention on Human Rights and the rules for the exchange of data. As Barnier noted, if the parties do not come to an understanding on this item, then further cooperation in this area will be "carried out in accordance with the norms of world law". Here you can also mention the contradictions in the field of law enforcement: we are talking about coordinated actions to combat terrorism, financial crime, organized crime and so on.

Another contradiction is more fundamental. We are talking about the legal basis for future relationships. Britain plans to enter into several agreements – in every area where this is necessary. Brussels insists on signing a single, comprehensive agreement. In addition, the UK does not want to agree to common terms for both sides in the deal.

And the last, fourth, disagreement is about fishing. London insists that fishing matters be discussed on a regular basis, that is, annually. On the contrary, Europeans want to include fishing in the structure of the general economic agreement. According to Barnier, the British position on the issue of fishing is "unacceptable".

As you can see, the positions of the parties are still at different poles, and the first round of negotiations was inconclusive. But the market nevertheless "trusted" Barnier's optimism, which expressed confidence that Brussels and London would still come to a common opinion on all key issues.

It is worth noting that last week, figuratively speaking, Brexit "did not prevent" the GBP/USD from growing, while the main driving force of the upward movement was the dollar, which swooped down on all fronts. Yesterday, the Federal Reserve Bank of New York significantly lowered its forecasts for US GDP growth in the first quarter of this year. While the previous estimate was at 2.15%, expectations have now dropped to 1.7%. Comments from Donald Trump's economic adviser, Larry Kudlow, also put pressure on greenback. According to him, certain sectors of the US economy will feel the "strong negative impact" of the epidemic, but it is "too early" to make decisions about supporting the economy with fiscal measures. At the same time, Trump himself is demanding that the Fed should hold another round of rate cuts.

In this case, we can talk about a certain de-correlation. For example, if the head of the Bank of England (Andrew Bailey) insists on applying fiscal responses, the White House is trying to offset the impending threat with monetary policy. And the Fed seems to agree with this scenario. At least, the latest comments from the Fed representatives (Bullard, Kaplan) indicate a willingness to further soften monetary policy. While representatives of the BoE and the ECB are increasingly reminded that they are limited in their actions – in particular, Bailey allowed a rate cut to 0.1%, but at the same time excluded the option of reducing to a negative area.

Thus, the pound is still in a winning position relative to the US currency. According to general market expectations, the Fed will lower the rate by another 25 basis points at the March meeting, and later, by another 25 basis points by the beginning of summer. In turn, the BoE can maintain a wait-and-see attitude on March 26, saving an arsenal of available actions for the future. Such a de-correlation provides support for GBP/USD, especially against the background of quite calm rhetoric of the Brexit negotiators. If this fundamental background for the dollar and the pound persists next week, the pair can test the next resistance level, which is located at 1.3105 - this is the lower boundary of the Kumo cloud on the daily chart.

Analysis are provided by InstaForex
 
Back
Top