InstaForex Gertrude
Active member
Forecast for EUR/USD on March 10, 2020
EUR/USD
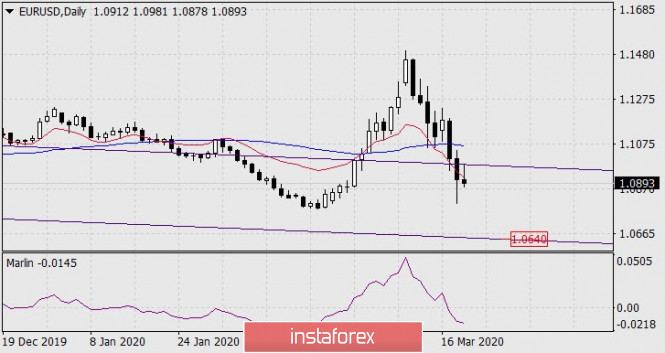
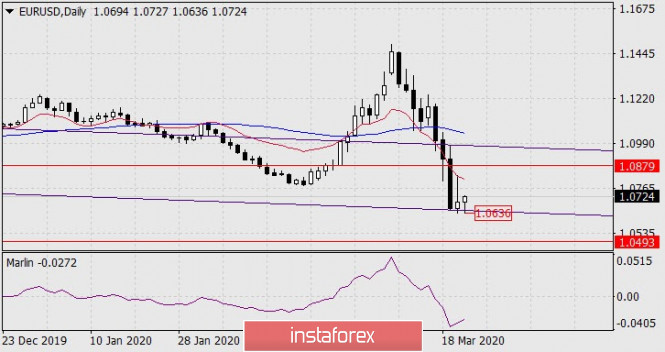
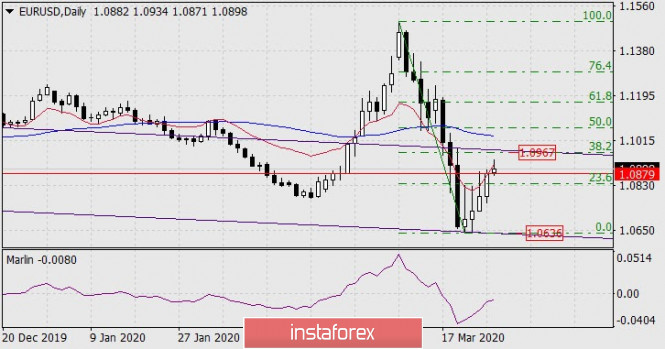
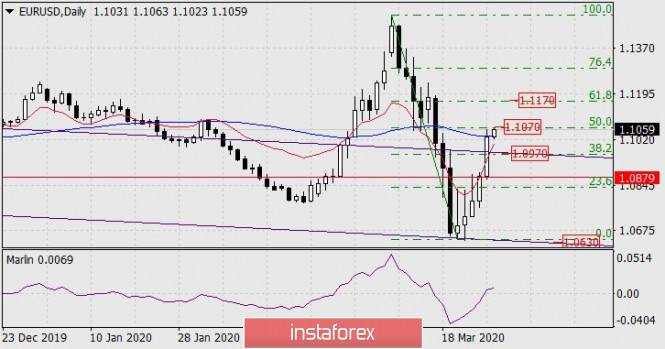
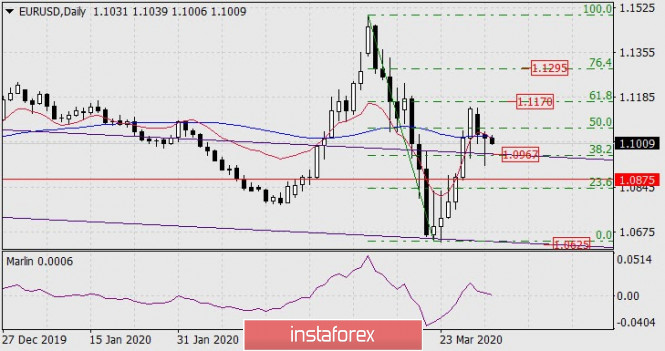
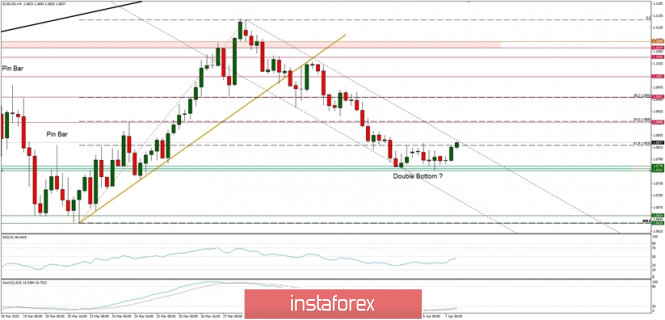
In the last three weeks of growth, the euro corrected 38.2% of the fall from February 2018 to February 2020. Today, in the Asian session, the euro's fall is more than 70 points, which shows the clear intention of the price to close the gap on Monday. Next, we are waiting for the testing of the Fibonacci level at the price of 1.1200, which coincides with the top on December 13 (marked with a tick).
Fixing the price below this level will direct the price to the support of the MACD line (1.1085). Fixing the price below it will confirm the market's intention to continue selling euros.
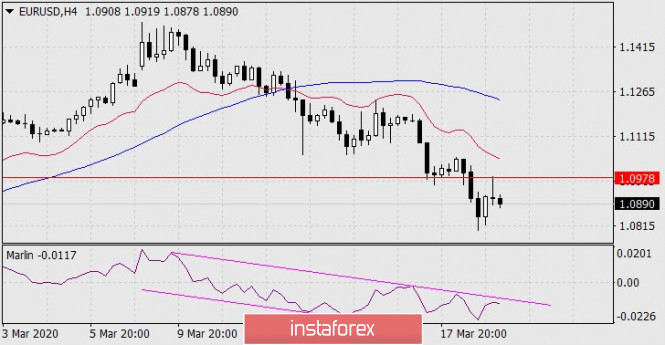
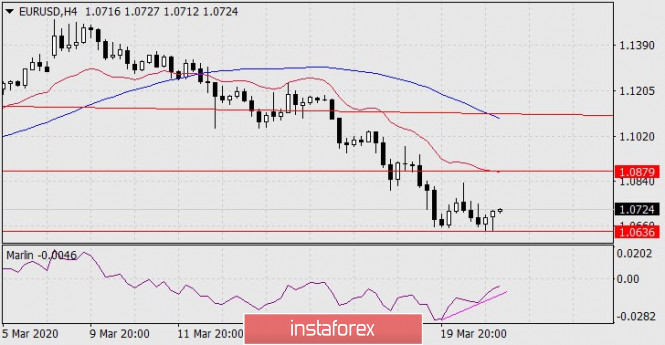
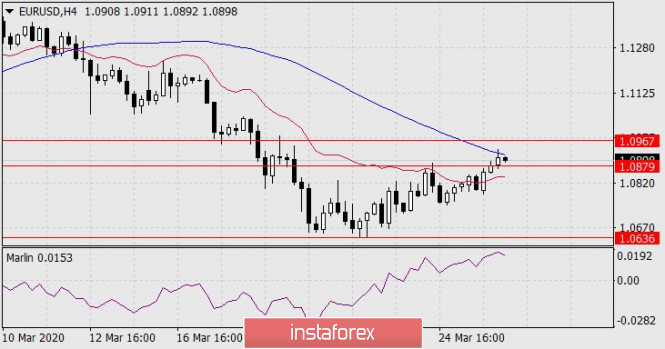
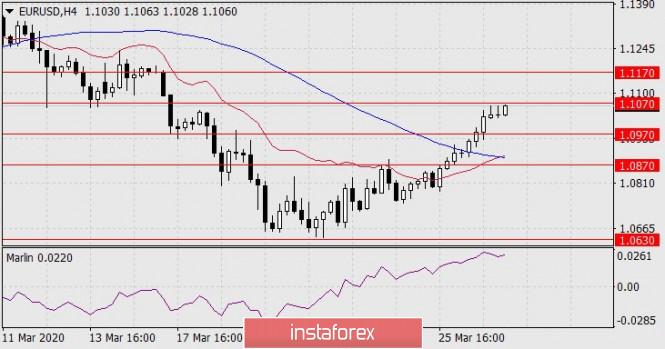
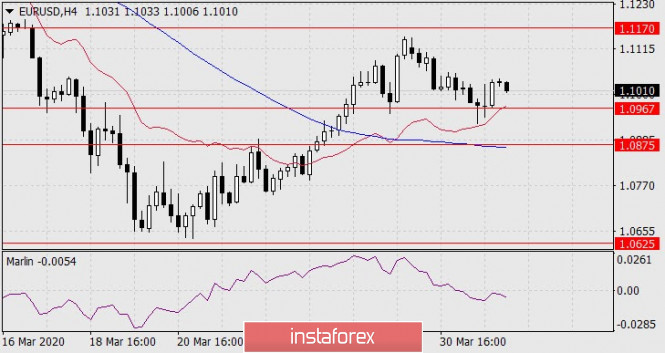
As seen on the four-hour chart, the signal line of the Marlin oscillator went down sharply. This is a sign of the market's intention to move down. The support for the MACD line at 1.1200 coincides with the 23.6% Fibonacci level on the higher-scale chart. Accordingly, the level is strong and requires increased care. *The market analysis posted here is meant to increase your awareness, but not to give instructions to make a trade.
Analysis are provided by InstaForex
EUR/USD
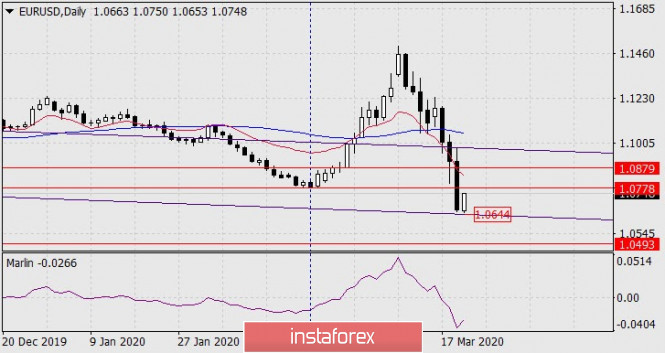
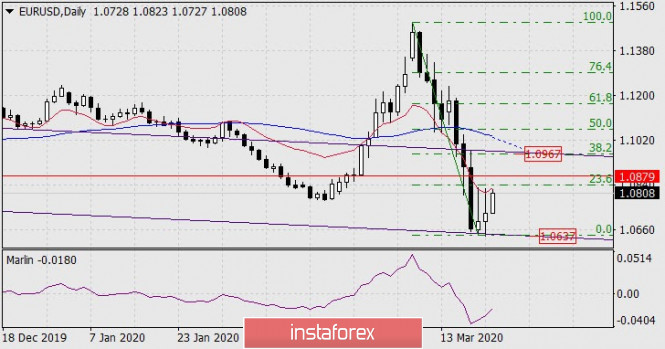
In the last three weeks of growth, the euro corrected 38.2% of the fall from February 2018 to February 2020. Today, in the Asian session, the euro's fall is more than 70 points, which shows the clear intention of the price to close the gap on Monday. Next, we are waiting for the testing of the Fibonacci level at the price of 1.1200, which coincides with the top on December 13 (marked with a tick).
Fixing the price below this level will direct the price to the support of the MACD line (1.1085). Fixing the price below it will confirm the market's intention to continue selling euros.
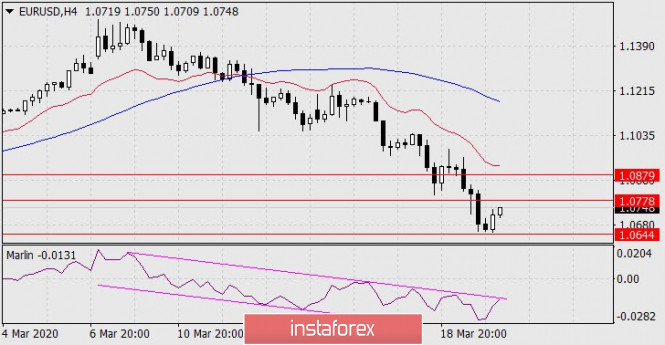
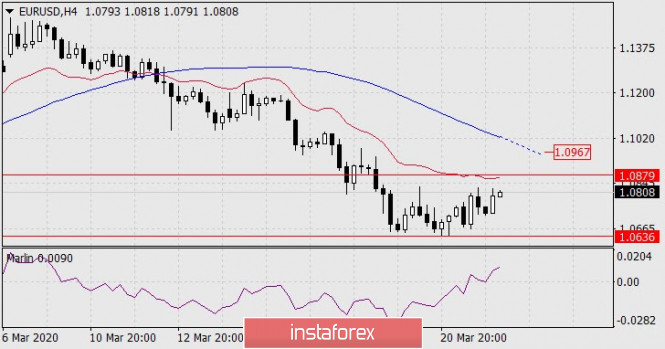
As seen on the four-hour chart, the signal line of the Marlin oscillator went down sharply. This is a sign of the market's intention to move down. The support for the MACD line at 1.1200 coincides with the 23.6% Fibonacci level on the higher-scale chart. Accordingly, the level is strong and requires increased care. *The market analysis posted here is meant to increase your awareness, but not to give instructions to make a trade.
Analysis are provided by InstaForex