Wave Analysis from InstaForex

Weekly market review

Greetings, dear traders! Congratulations to everyone on the beginning of autumn and, hopefully, on the increase in volatility associated with the end of the holiday period, including the bank traders, and the Forex market, as you know, is the interbank market, and the private traders who are here – random people.

The first week of autumn is an important trading period associated with a change in order placements in anticipation of non-farm payrolls, and after them. Often, it is the "nanoc" that one ends and other tendencies of instruments related to the American dollar begin. Today, Monday, according to most professional traders, is the worst time to open new trading positions and decide on a change in trading trends. Moreover, it is also today, September 2, 2019 - is a holiday in the USA and Canada - Labor Day. Therefore, let us congratulate the United States labor teams on this holiday!

For us, this means that trading during this evening will take place in narrow ranges and it is not worth waiting for super-movements from the markets today. Only "Donald Trump" can break the "trade silence" with his Twitter. Sometimes, it seems to me that Donald is an avid trader who "rules" his unprofitable positions with his own, often diametrically opposite, statements on the network.

Today, the main trading idea related to the American dollar for me is to strengthen the dollar in USD/JPY and GBP/USD, which gave last week. I also have very interesting ideas on certain crosses, which will be published soon.

What to do for traders in a period of low volatility? Of course, developing trading skills in the "strategy tester", as well as working on the analysis of profitable / unprofitable positions of the last week, in order to understand - how you earn and how much you lose and at what volumes and at what time you have it is obtained most efficiently. Good luck in trading! And see you at the evening reviews of cross-courses!

Analysis are provided by InstaForex
 
Golden cosmos

Good evening, dear traders. As promised, here's the evening forecast for gold. Sorry, was not able to publish it in the morning, because it has already started to work.

The trade wars drove gold to an incredible $ 1,550 per troy ounce. This is the largest gold trend. for many years! Over the past year, gold has passed a record of 36,000p and continues to storm the high, knocking out the stops of medium-term sellers. And just yesterday, according to perhaps the most effective Price Action trading strategy, a pattern called "daily absorption in the trend" has appeared - which speaks of an ongoing trend and after which it is recommended to buy. Today, to the American session, there was a magnificent rollback, allowing you to go into longs at the best price.

On the other hand, sellers who have been selling gold from highs for two weeks now have to hide their risks only for one single extreme - this year's high - quotation 1554. Although, gold has not yet risen above. This is a trap that will be slammed in the near future and trap sellers.

I propose to take a closer look from the rollbacks to the longs - with a take on updating 1554 and higher. Often breakdowns of weekly extremes for gold are very volatile - and give a positive slippage, on which you can earn good profit. This is the first part of the plan.

The second part is for those traders who are buying in a large amount (scalpers). The idea is very simple and is to work after the breakdown of 1554, which for example to 1560-1570, and then to return to the broken level of 1554. This is an old scalping technique in the overbought market to work on the consolidations of large buyers after the breakdown of key extremes. It is due to this that the price decline to a broken level, which becomes support.

Be that as it may, you can earn in both cases.

I wish you success in trading and follow the policy of money management!

News are provided by InstaForex
 
Taking profit on USD/JPY and GOLD

This is not a random number, because the method of "hunting for stops" involves work tied to the mistakes of bank traders. The average amount of stops which makes these 100p. And you can easily check it by looking at the open positions of banks online right now. Thus, we still have positions in crosses - which are also all in the "plus".

In addition, fix part of the profit from the position on gold left overnight + 430p, and hold the last part at the level of 1500:

Tomorrow is an important day for currency traders. I have noticed many times that if you give out before non-game plus - you have to leave, because the news is extremely unpredictable. Therefore, I prefer to trade after news trends, and for this, you need to have patience. The best choice for traders to trade on the USD news (if you are not a stop hunter) is to sit them in crosses. And fortunately, our diversification tactics make this easy to do. We continue to hold positive positions on AUD/CHF or NZD/CHF according to the recommendations given earlier.

Good luck in the trading and see you at the next reviews!

Analysis are provided by InstaForex
 
Forecast for AUD / USD pair on September 11, 2019

AUD / USD pair
In the last two days, the Australian dollar has fixed above both lines of the price channels (red and blue) for the weekly and monthly scales. The price is also higher than the balance lines and MACD daily chart. The nearest target is open to July 10 minimum at 0.691. Subsequent consolidation above a new level opens the second target of 0.6962, which is the upper border of the blue (weekly) price channel.

For the development of a falling scenario, the price should fall below the support of the MACD line on the four-hour chart at 0.6815. Under this condition, the downward target below opens to 0.6685, which is the embedded line of the red (monthly) price channel.

Analysis are provided by InstaForex
 
Gold: a great opportunity to buy at the level of $1480-50

According to Bart Melek, the head of TD Securities, the strengthening of the dollar, the growth of the value of US stocks and bond yields reflected on the prospects for gold and long positions in the asset. "The yellow metal fell to just below $1,500 an ounce at the beginning of the week, and we think that the price could move to the support level between $1,480–50 if the Fed doesn't weaken the policy at the next meeting," Meleka said. At this stage, the gold market believes that the US central bank will keep rates at the current level without any unconditional commitments to aggressively lower rates in the future. "In our opinion, no matter what central banks do over the next few months, the global economy will decline due to weaker trading activity amid a trade war between the US and China."

The largest world markets are under attack. Germany is showing weakness, China continues to disappoint with its performance, and there are signs that the US economy is also slowing. Given these facts and that monetary policy is not very productive, the projected decline in the price of gold should be considered as an excellent buying opportunity, since central banks need to be aggressive in their actions in order to avoid a sharp drop in global activity next year.

Analysis are provided by InstaForex
 
EUR/USD. "Bear feast" cancelled: the ECB disappointed sellers of the pair

The proposition "buy on the rumor, sell on the news" summed up many EUR/USD traders today. It turned out the other way around: over the past few days, the pair has been selling on rumors of a large-scale easing of the ECB's monetary policy, and after the news, the euro then updated its high of the day and week. This situation confirms another notorious fact: anything can happen in the market, and even the most recognized algorithms sometimes fail.

However, so far it is only a short-term reaction of traders. There is no talk of any turning point in the trend, since the price has remained in the same positions as all previous days. If you do not take into account the 150-point price fluctuation, then we can say that the September meeting of the ECB did not affect the value of the pair. Of course, this fact looks anomalous, since all the decisions and theses voiced at today's meeting were against the euro. Perhaps, with one exception: Mario Draghi did not announce a further reduction in the interest rate. In other words, the entourage of previous events played a key role today. Representatives of the ECB, all kinds of experts, analysts, currency strategists and the successor of Mario Draghi - Christine Lagarde - all of them have been aggravating the situation for several weeks, preparing the market for large-scale easing of monetary policy parameters.

The European Central Bank as a whole met the expectations of the market by lowering the interest rate by 0.1% and announcing the resumption of QE from November 1 by 2.6 trillion euros with a monthly volume of 20 billion euros. But, as you know, "appetite comes with eating": market participants were ready for more drastic measures (lowering rates to -0.60%, and QE with a monthly volume of 40-50 billion). At least on the eve of today's meeting, precisely these values were discussed among experts (which, in fact, was responsible for the downward impulse of EUR/USD at the beginning of this week). Therefore, when the central bank announced its decision, the pair fell to the bottom of the 9th figure on emotions. Then the price bounced back - when it became clear that the regulator, firstly, didn't use the arsenal of available tools "to the fullest", and secondly, it made it clear that it did not intend to take the interest rate further into the negative area for the foreseeable future.

A similar situation was seen in December 2015. Back then, the European regulator abandoned the idea of using shock therapy, focusing on the option of a gradual and longer-term effect. In exactly the same way as now, four years ago, everyone was expecting and discussing the rate reduction during the previous several months. They also spoke with the same confidence about the expansion of the stimulating program: opinions differed only with regard to the size of the increase. However, the regulator only reduced the rate and did not resort to large-scale integrated measures. Moreover, Draghi made it clear that the ECB will not return to the issue of easing monetary policy for at least several months, giving the European economy time to recover. After this meeting, the EUR/USD pair rebounded and strengthened by 300 points, although many predicted the euro collapse.

Now the situation is somewhat different. On the one hand, Mario Draghi is unlikely to initiate and support the issue of further easing of monetary policy - at least until November. But his cadence ends in the last month of autumn, so the ECB's further steps will largely depend on Lagarde, who has already announced that the monetary policy is adaptive "in the foreseeable future", and the nature of the regulator's further actions will depend on the conditions of the financial market . She also said that she "does not believe" that the central bank has set an effective lower limit for interest rates. In other words, the future head of the ECB fairly transparently hinted at an acceptable backlash in this matter. This means that, hypothetically, the European regulator may not be limited to one round of lowering rates further into the negative area.

That is why the reaction of the EUR/USD bulls to the results of the September meeting is relatively limited. I can assume that if it were not for the "Lagarde factor", then the pair would be at least in the middle of the 11th figure, and maybe it would test more significant price heights. But for now, EUR/USD is trying to overcome only the middle line of the Bollinger Bands indicator on the daily chart, which corresponds to the mark of 1.1060. If the bulls consolidate on this target, then the price will be the second resistance level of 1.1150 - this is the upper line of Bollinger Bands, which coincides with the lower boundary of the Kumo cloud on the same timeframe. In general, the next critical "test" for the pair will take place next week, when the September meeting of the Federal Reserve will take place. If the members of the US regulator, in contrast to the ECB, exceed the "dovish" expectations of investors, then the large-scale correction will be continued - up to 12-13 figures.

Analysis are provided by InstaForex
 
Oil flies into the stratosphere

Attacks on tankers in the Persian Gulf and a downed American drone are children's toys compared to the attack on Abqaiq, the world's largest oil refinery in Saudi Arabia, through which about 7 million b/d passes. Brent and WTI have responded with the largest daily rally in history, and it cannot be said that investors have calmed down. The attack can easily be repeated, the US war with Iran is more real than ever, and who, interestingly, in such circumstances will risk actively selling black gold?

An armed attack turned off 5.7 million bpd from the game, which is about 5% of global production. Although Riyadh is trying in every possible way to convince investors that everything is under control and within a day, about a third of the losses in black gold production have already been restored, insider Bloomberg says something else. According to at least four competent sources, the restoration is likely to drag on from a few weeks to several months, and a reduction in global production will provide all possible assistance to the Brent and WTI bulls. Everyone is waiting for comments from Prince Abdulaziz bin Salman, but the very figure of this man deserves close attention.

After a member of the royal family became the Minister of Energy for the first time in history, many suspected that something was wrong. Prices rose by leaps and bounds, and the attack on Abqaiq is perceived as a bolt from the blue, but only by a majority. When a crime occurs, one always wonders, "who benefits?" For a balanced budget, Saudi Arabia needed oil at $80 per barrel, but before the appointment of Abdulaziz bin Salman as minister, there were few reasons for a rapid rally. Reducing OPEC production did not help: the Americans were actively increasing production, and China was cutting demand. For a sharp rise in prices, force majeure was needed, and in an amazing way it became a reality.

One-day oil jumps

According to Bloomberg, the maximum reserve capacity that can be put into production in the coming weeks is 3.9 million bpd. Even if Riyadh recovers a third of the losses from 5.7 million bpd, there will be a reduction in production. And with it, the growth of Brent and WTI quotes. As for Saudi Arabia, it is in its interest to spread rumors about a slow return to previous levels and the disruption of the October supplies, as well as to call other OPEC members to implement Vienna agreements, which the Saudis do.

At the same time, the issue of the United States and Iran's trade war, which the United States accused of organizing the attack on Abqaiq, does not come up on the agenda. Tehran denies any involvement, and based on the principle "who needed it most", it is very likely that it really has nothing to do with it.

Technically, after completing the targeting on the Bat (113%) and Wolfe Waves patterns, the risks of a pullback increased to the levels of 23.6% and 38.2% of wave 4-5. End of support at $66.4 and $64.4 per barrel will attract new buyers to the market.

Analysis are provided by InstaForex
 
Forecast for AUD / USD pair on September 19, 2019

AUD / USD pair

The Australian dollar successfully broke the support area, consisting of two lines - balance and MACD of price channels and indicator lines. Moreover, the breakthrough occurred today on quite good employment data. The growth of new jobs amounted to 34.7 thousand against the expectation of 10.0 thousand and the share of the economically active population increased from 66.1% to 66.2%. Against this background, the level rose slightly to 5.3% from 5.2%, which is a fairly strong sign of the market's intention to sell the AUD/USD pair at an accelerated pace.

The Immediate target of 0.6678 at the support line for the red price channel coincides with the low of August 7 that can be reached in three days. Then, the blue channel comes into play with support in the region of 0.6605. On the four-hour chart, the price is in free fall and there are no signs of a stop in the correction.

Analysis are provided by InstaForex
 
Before I decided on spending money on the purchase of digital coins, I found out how risky such investments are. What results can be expected from them? In what currency it is more profitable to invest? My colleague advised me to try this platform he trusted himself. The protected interface allows you to work from any part of the world - Asia or the USA - as the creation of digital money is based on unique technologies used around the world. And if you are already an experienced trader, you can accelerate and make your investments work quicker. Moreover, the powerful charting engine, along with the margin, will give you a chance to invest in other e-coins.
 
Fractal analysis of the main currency pairs for September 23

Forecast for September 23:
Analytical review of currency pairs on the scale of H1:

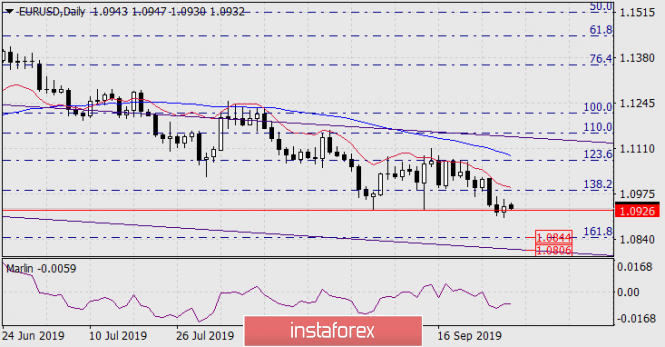
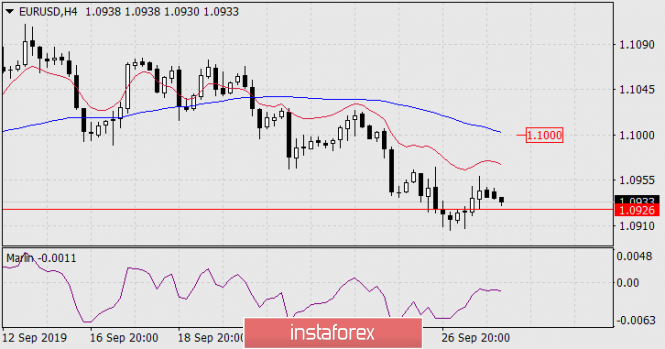
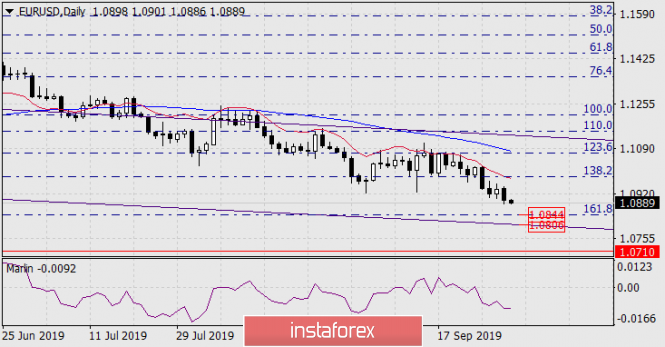
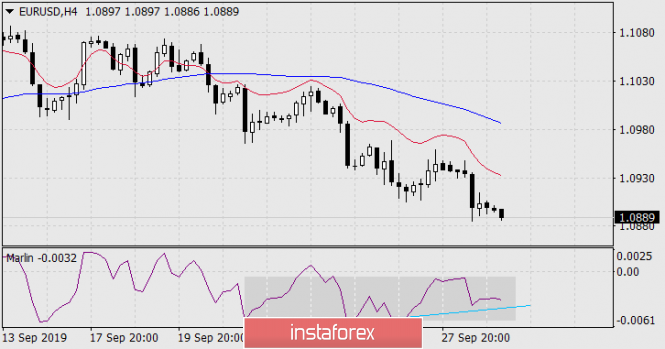
For the euro / dollar pair, the key levels on the H1 scale are: 1.1227, 1.1188, 1.1135, 1.1114, 1.1079, 1.1019, 1.0987 and 1.0932. Here, the price is close to the cancellation of the ascending structure of September 12, which requires a breakdown of the level of 1.0987. In this case, the first potential target is 1.0932. The continuation of the movement to the top is expected after the breakdown of the level of 1.1080. In this case, the first goal is 1.1114. The passage at the price of the noise range 1.1114 - 1.1135 should be accompanied by a pronounced upward movement. Here, the goal is 1.1188. For the potential value for the top, we consider the level of 1.1227. Upon reaching this value, we expect a pullback to the bottom.

The main trend is the local structure for the top of September 12.

Trading recommendations:
Buy: 1.1080 Take profit: 1.1114
Buy 1.1135 Take profit: 1.1188
Sell: 1.1019 Take profit: 1.0990
Sell: 1.0985 Take profit: 1.0935

For the pound / dollar pair, the key levels on the H1 scale are: 1.2738, 1.2673, 1.2622, 1.2549, 1.2460, 1.2403, 1.2338 and 1.2281. Here, we continue to monitor the local ascendant structure from September 12. The continuation of the movement to the top is expected after the breakdown of the level of 1.2549. In this case, the target is 1.2622. Price consolidation is in the range of 1.2622 - 1.2673. For the potential value for the top, we consider the level of 1.2738. Upon reaching which, we expect a pullback to the bottom. We expect consolidated movement in the range of 1.2460 - 1.2403. The breakdown of the latter value will lead to an in-depth correction. Here, the target is 1.2338. This level is a key support for the top. Its passage at the price will lead to the development of a downward structure. In this case, the first goal is 1.2281.

The main trend is the local ascending structure of September 12.

Trading recommendations:
Buy: 1.2550 Take profit: 1.2620
Buy: 1.2674 Take profit: 1.2736
Sell: 1.2401 Take profit: 1.2340
Sell: 1.2336 Take profit: 1.2282

For the dollar / franc pair, the key levels on the H1 scale are: 0.9983, 0.9962, 0.9941, 0.9927, 0.9893, 0.9868, 0.9835, 0.9813 and 0.9783. Here, we expect the development of the downward structure of September 19. The continuation of the movement to the bottom is expected after the breakdown of the level of 0.9893. In this case, the target is 0.9868. Price consolidation is near this level. The breakdown of the level of 0.9868 should be accompanied by a pronounced downward movement. Here, the target is 0.9835, Short-term downward movement, as well as consolidation is in the range of 0.9835 - 0.9813. For the potential value for the bottom, we consider the level of 0.9783. Upon reaching this level, we expect a pullback in correction. Short-term upward movement is possibly in the range of 0.9927 - 0.9941. The breakdown of the latter value will lead to an in-depth correction. Here, the goal is 0.9962. This level is a key support for the descending structure of September 19.

The main trend is the formation of the downward potential of September 19.

Trading recommendations:
Buy : 0.9927 Take profit: 0.9940
Buy : 0.9942 Take profit: 0.9960
Sell: 0.9893 Take profit: 0.9870
Sell: 0.9866 Take profit: 0.9835

For the dollar / yen pair, the key levels on the scale are : 108.21, 107.95, 107.77, 107.50, 107.25, 107.06 and 106.82. Here, we are following the development of the descending structure of September 19. The continuation of the movement to the bottom is expected after the breakdown of the level of 107.50. In this case, the target is 107.25. Short-term downward movement, as well as consolidation is in the range of 107.25 - 107.06. For the potential value for the bottom, we consider the level of 106.82. Upon reaching this level, we expect a pullback to the top. Short-term upward movement is possibly in the range 107.77 - 107.95. The breakdown of the last value will lead to an in-depth correction. Here, the goal is 108.21. This level is the key support for the downward structure from September 19.

Main trend: descending structure of September 19.

Trading recommendations:
Buy: 107.77 Take profit: 107.93
Buy : 107.97 Take profit: 108.20
Sell: 107.50 Take profit: 107.27
Sell: 107.23 Take profit: 107.08

For the Canadian dollar / US dollar pair, the key levels on the H1 scale are: 1.3379, 1.3343, 1.3326, 1.3297, 1.3260, 1.3235, 1.3198 and 1.3172. Here, we continue to monitor the development of the ascending structure of September 10. The continuation of the movement to the top is expected after the breakdown of the level of 1.3297. Here, the target is 1.3326. Price consolidation is in the range of 1.3326 - 1.3343. For the potential value for the top, we consider the level of 1.3379. Upon reaching this level, we expect a pullback to the bottom. Short-term downward movement and consolidation are possible in the range of 1.3260 - 1.3235. The breakdown of the last value will lead to an in-depth correction. Here, the target is 1.3198. This level is a key support for the top. Its breakdown will have the downward structure. In this case, the potential goal is 1.3172.

The main trend is the rising structure of September 10, the correction stage.

Trading recommendations:
Buy: 1.3299 Take profit: 1.3226
Buy : 1.3344 Take profit: 1.3378
Sell: 1.3260 Take profit: 1.3237
Sell: 1.3233 Take profit: 1.3200

For the Australian dollar / US dollar pair, the key levels on the H1 scale are : 0.6822, 0.6797, 0.6782, 0.6745, 0.6732, 0.6705 and 0.6683. Here, we are following the development of the downward cycle of September 13. Short-term downward movement is expected in the range 0.6745 - 0.6732. The breakdown of the last value should be accompanied by a pronounced downward movement. Here, the target is 0.6705. Price consolidation is near this value. For the potential value for the bottom, we consider the level of 0.6683. Upon reaching which, we expect a departure in the correction. Short-term upward movement is possibly in the range of 0.6782 - 0.6797. The breakdown of the last value will lead to a long correction. Here, the potential target is 0.6822. This level is a key support for the downward structure.

The main trend is the downward cycle of September 13.

Trading recommendations:
Buy: 0.6782 Take profit: 0.6795
Buy: 0.6800 Take profit: 0.6822
Sell : 0.6745 Take profit : 0.6734
Sell: 0.6730 Take profit: 0.6707

For the euro / yen pair, the key levels on the H1 scale are: 119.41, 119.02, 118.74, 118.28, 118.01, 117.73, 117.51 and 117.10. Here, we are following the development of the descending structure of September 18. Short-term downward movement is expected in the range 118.28 - 118.01. The breakdown of the latter value will lead to a movement to the level of 117.73. Price consolidation is in the range of 117.73 - 117.51 . For the potential value for the bottom, we consider the level of 117.10. From this level, we expect a rollback to the top. Short-term upward movement is possibly in the range 118.74 - 119.02. The breakdown of the latter value will lead to in-depth movement. Here, the goal is 119.41. This level is a key support for the downward structure.

The main trend is the descending structure of September 18.

Trading recommendations:
Buy: 118.75 Take profit: 119.00
Buy: 119.04 Take profit: 119.40
Sell: 118.28 Take profit: 118.03
Sell: 118.00 Take profit: 117.74

For the pound / yen pair, the key levels on the H1 scale are : 137.21, 136.13, 135.37, 134.10, 133.39 and 132.23. Here, we are following the local ascendant structure of September 12. Short-term upward movement is expected in the range of 135.37 - 136.13. The breakdown of the last value will lead to movement to a potential target - 137.21, when this level is reached, we expect a pullback to the bottom. Short-term downward movement is possibly in the range 134.10 - 133.39. The breakdown of the last value will lead to an in-depth correction. Here, the goal is 132.23. This level is a key support for the upward structure.

The main trend is the ascending structure of September 3, the local ascending structure of September 12.

Trading recommendations:
Buy: 135.38 Take profit: 136.10
Buy: 136.15 Take profit: 137.20
Sell: 134.10 Take profit: 133.42
Sell: 133.35 Take profit: 132.30

Analysis are provided by InstaForex
 
Yen came with trump cards

The economic calendar of the last full week of September can hardly be called saturated, so investors will be focused on events of a geopolitical nature. The trade war, the conflict in the Middle East and Brexit are forcing investors to pay attention to safe haven assets, all the more so since the yen, which has become pretty cheaper in the first half of the month, is starting to look like a tidbit.

Over the past 3 weeks, USD/JPY quotes have grown by 4% amid closing short positions. De-escalation of the US-China trade conflict, lower Fed rates, revival of the European QE, a decrease in the probability of disorderly Brexit and strong macro statistics across the United States convinced investors that not everything was as bad as is commonly believed. Is it time to reduce the share of safe haven assets in portfolios? As a result, the yield on US treasury bonds began to grow, and the yen, franc and gold were in a black body. As subsequent events showed, not for long.

The attacks on Saudi Arabia, the statement by Donald Trump that he did not need a temporary deal with China on the eve of the presidential election, as well as the refusal of the Chinese delegation to visit American farmers, were seen as a signal of worsening global risk appetite and relations between Washington and Beijing. Riyadh claims that the terrorist attack was certainly funded by Tehran, and Donald Trump sends troops to the Allied camps in the Middle East and imposes sanctions against the Iranian central bank. How not to buy bonds and other safe havens in such conditions?

A deterioration in global risk appetite and a return to interest in the yen are making life difficult for the Bank of Japan. We watched the USD/JPY correction, realizing that devaluation would help accelerate inflation. Consumer prices in Japan slowed to 0.5% y/y in August, which is the worst trend since 2017.

The dynamics of Japanese inflation

Slowing inflation theoretically unties the hands of the central bank in easing monetary policy, but everything looks different in real life. Haruhiko Kuroda is confronted by the Fed's inability to weaken the US dollar even by lowering federal funds rates and EUR/USD growth in response to the revival of the ECB's quantitative easing program. It is obvious that a further drop in the overnight rate (-0.1%) in the red zone will only aggravate the problems of Japanese banks. In the current situation it is better to sit and see how events will develop. Perhaps negotiations between Washington and Beijing will result in a breakthrough and increase in global risk appetite ... On the contrary, the resumption of the rally in the oil market poses a threat to countries importing black gold and strengthens the demand for safe-haven assets.

Technically, the bulls' inability to hold USD/JPY quotes above the upper limit of the downward trading channel is the first sign of their weakness. After reaching an intermediate target of 78.6% according to the Shark pattern, a logical pullback followed, which risks continuing in the direction of 106.9 and 106.25. The main task of the bears is to keep the pair below 107.5.

Analysis are provided by InstaForex
 
Gold does not like the president

The worst dynamics of business activity in the manufacturing sector in Germany over the past 10 years, the fastest decline in the consumer sentiment index in the US since the beginning of the year and rumors about the impeachment of Donald Trump - what could be better for safe haven assets?. The frank and the yen grew steadily, Treasury yields collapsed, and bulls on gold resumed attacks aimed at updating the 6-year high. The precious metal is preparing to close in the green zone for the fifth month in a row, and we must admit that it has reason for this.

When the leading economies of the world in the form of China, Germany and the US slow down, and central banks try to save the situation by easing monetary policy, the bulls on XAU/USD feel like a fish in water. Monetary expansion weakens major world currencies, and even the growth of the USD index does not scare fans of gold: it is not the dollar that is strong, its competitors are weak. Moreover, the Fed is cutting rates and, according to TD Securities forecasts, in order to eliminate the crisis in the money market, it will revive a program of quantitative easing in the amount of $515 billion in October. At the same time, political risks increased in the United States due to rumors about the impeachment of Donald Trump, which will contribute to the loss of steam by the US economy and global GDP. Is it any wonder that the treasury bond yields dropped sharply? The dynamics of gold and yield on US Treasury bonds

The fact that the bullish XAU/USD trend is stronger than ever is evidenced by an increase in stocks of specialized exchange-traded funds to a 6-year high and an increase in Swiss precious metal exports to Britain to 112.5 tons, which is the highest value for the last 7 years . As a rule, when gold flows from the West (US, Britain) to the East (China, India), sellers dominate the market; when it changes its direction - buyers. Switzerland serves as a transit point and a kind of indicator of the activity of investors and jewelers. As for ETF reserves, they reached the level of 2494.3 tons and are ready to mark the best quarterly growth from April-June 2016.

Yes, the impeachment of the current head of the White House seems unlikely, but it undermines the political authority of Donald Trump and unties the hands of China. It is possible that China will continue to pull the cat by the tail, sincerely hoping that the main enemy could resign himself long before the presidential election of 2020. The October talks in Washington and Beijing may not be as productive as financial markets expect, which will lead to the development of a correction on US stock indices and will allow the bulls to develop an attack on XAU/USD.

Technically, the inability of the bears for gold to keep quotes below the trend line of the Burst stage of the "Bump and Run Reversal" pattern indicates their weakness. The precious metal quickly returned to the game and if the September high is updated, the AB=CD pattern will be activated. Its target of 161.8% corresponds to the mark of $1600 per ounce

Analysis are provided by InstaForex
 
Forecast for EUR/USD on September 27, 2019

EUR/USD
On Thursday, amid a calm political background, the euro pushed through the signal support of 1.0926 and is now ready to work out the target range of 1.0805/45. The final estimate of US GDP for the 2nd quarter remained unchanged at 2.0%, which supported moderate optimism in the market. Today, orders for durable goods for August are expected to decrease by -1.1%, but personal income is projected to grow by 0.4%, as well as expenditures by 0.3%. Taking into account yesterday's data on incomplete sales in the secondary market at 1.6% against the forecast of 1.0%, as well as rising indicators for real estate prices and growth in consumer confidence released this week, data on expenses and income may even exceed expectations. which can become the main news of the day.

Technically, on the daily chart, the situation is completely falling - chart indicators and the oscillator in a downward position.

On the four-hour chart, there is also a downward trend; price below the lines of balance and MACD, the signal line of the Marlin oscillator forms a kind of triangle, which may be a sign of a continuation of the downward trend.

*The market analysis posted here is meant to increase your awareness, but not to give instructions to make a trade.

Analysis are provided by InstaForex
 
Forecast for EUR/USD on September 30, 2019

EUR/USD

On Friday, after the euro's attempt to overcome support at 1.0926, the price chose to return a little higher in order to try to do it with fresh energy in the new week. This morning a little strength was given by economic data on the Asia-Pacific; retail sales for August show growth of 2.0% y/y against the forecast of 0.7% y/y, business activity in the manufacturing sector of China (Manufacturing PMI) for September increased from 49.5 to 49.8. In the afternoon, employment indicators in the euro area will come out, forecasts are neutral, so investors are interested in how much the data deviate from expectations.

analytics5d918f93e4173.png


On a four-hour chart, the price is near the signal level of 1.0926, consolidating below it will launch the main decline scenario. We are waiting for the price in the target range of 1.0806/44, formed by the line of the price channel and the Fibonacci level of 161.8%. Strong economic indicators in the euro area and weak in the US (if the Chicago PMI is weaker than the forecast of 50.0) may pull up the euro to the MACD line, to around 1.1000.

analytics5d918fa9be05a.png


*The market analysis posted here is meant to increase your awareness, but not to give instructions to make a trade.
 
Forecast for EUR/USD on October 1,2019

EUR/USD

The euro fell by 38 points on Monday. The readings of technical indicators have become even more bearish. On the daily chart, the Marlin oscillator penetrates deeper into the negative trend zone. The target range is the gap from the price channel line to the Fibonacci level of 161.8% - 1.0806/44. Consolidating the price below it opens the second target at 1.0710 - the low of January 2016.

analytics5d92c838e395a.png


On a four-hour chart, the signal line simultaneously develops in two conflicting patterns; a convergence reversal formation is formed, but within the framework of a simple rectangle. In this case, both signals lose power. In the evening, ISM Manufacturing PMI will be released in the September assessment - the forecast is 50.4 versus 49.1 in August, and an increase can also be shown for construction costs in August - the forecast is 0.5% against 0.1% earlier. We look forward to further weakening of the eur

analytics5d92c84edf98c.png


*The market analysis posted here is meant to increase your awareness, but not to give instructions to make a trade.
 
Trading Idea for NZD/CAD

As you know, cross-rates are an excellent tool for hedging positions in "majors", such as the most popular of them - the EUR/USD pair.

I recommend for each position in major - to have a position in the "right" cross, and you will appreciate this tactic of distributing profits between instruments.

Let's pay attention to the very oversold NZD/CAD cross-instrument, which has passed 10,000 p for 5 figures almost without a pullback since March 2019. However, several people know that this cross has an average rollback passage of exactly 10 points. And right now, after updating the minimum of 2015, it makes sense to buy it with a potential of at least 3,000 p at 5 figures.

It is easier to do this by collecting a grid of orders in longs on pullback movements. In fact, you will work out a false breakdown on an annual scale, or rather - for 4 years. This does not happen every day. Therefore, it is necessary to take advantage of this unique opportunity.

Analysis are provided by InstaForex
 
Elliott wave analysis of GBP/JPY for October 4 - 2019

GBP/JPY is now hovering just above the ideal corrective target at 130.78. We continue to look for a final dip closer to this target as long as minor resistance at 132.55 and more importantly as long as resistance at 133.36 is able to cap the upside. However, a break above resistance at 133.36 will indicate that red wave ii has completed and red wave iii towards 139.15 is developing.

R3: 133.36
R2: 132.85
R1: 132.55
Pivot: 132.00
S1: 131.47
S2: 131.25
S3: 130.78

Trading recommendation:
We will buy GBP at 131.25 or upon a break above 132.55

Analysis are provided by InstaForex
 
Control zones GBP/USD 10/07/19

The pair is trading between two significant zones. The resistance was Weekly Control Zone 1/2 1.2388-1.2372, and the weekly CZ 1.2246-1.2213 became the support. To continue medium-term growth, closing of trading above the level of 1.2388 on Monday will be required. This will pave the way for the September maximum. This model has a 50% chance of working out.

The continuation of the medium-term growth may become the main model for the coming week, as many pairs associated with the dollar formed a reversal pattern in the direction of strengthening.

An alternative model will be developed if the Weekly Control Zone 1/2 test leads to an increase in supply and a halt to growth. This will indicate the formation of a local accumulation zone, where the main goals will be the extremes of last week.


Daily CZ - daily control zone. The zone formed by important data from the futures market that changes several times a year.
Weekly CZ - weekly control zone. The zone formed by the important marks of the futures market, which change several times a year.
Monthly CZ - monthly control zone. The zonethat reflects the average volatility over the past year.


News are provided by InstaForex
 
Fractal analysis of Bitcoin on October 8

Forecast for October 8:
Analytical review of cryptocurrency on a scale of H1:

For the Bitcoin instrument, the key levels on the H1 scale are: 9026.00, 8811.75, 8666.36, 8379.42, 8287.60, 8039.21, 7893.53 and 7698.41. Attention! This instrument is characterized by medium-term trend trading. Here, as expected, the price formed a local structure for the top of October 7. In addition, this instrument has a good correlation with the euro / yen.

The range for entering the market for the purchase is 7948.00 - 8380.00. We expect the development of the upward cycle after the price passes the noise range 8287.60 - 8379.42. In this case, the first goal is 8666.36. Meanwhile, price consolidation is in the range of 8666.36 - 8811.75, as well as a possible rollback to correction. The potential value for the top, where it makes sense to close the position - 9026.00. The range 8039.21 - 7893.53 is a key support for the ascending structure. Its passage at the price will lead to the cancellation of this structure. In this case, the first goal is 7698.41. However, to trade in a downward direction, it makes sense when the local initial conditions for a downward cycle are formed.

The main trend is the initial conditions for the top of October 7.

Trading recommendations:
Buy: 7948.00 - 8380.00 Stop Loss: 7891.00 Take profit: 8666.36
To continue :
Stop Loss: 8287.60 Take profit: 9026.00

Analysis are provided by InstaForex
 
Forecast for AUD/USD on October 9, 2019

AUD/USD
the opening of the week, the Australian dollar has developed on the scale of a four-hour chart. All days, until this morning, the price was reflected from the support of the MACD line of a four-hour scale. The signal line of the Marlin oscillator penetrates into the growth zone.

Now the aussie is ready to close the gap formed at the beginning of the week. The purpose of growth is the line of the price channel of the daily scale near the MACD line at around 0.6790. We the fall to resume from the target level.

Analysis are provided by InstaForex
 
Back
Top