Wave Analysis from InstaForex

GBPUSD. Bank of England dissidents, predictions and phlegmatic pound

The results of "Super Thursday" were expectedly not in favor of the British currency, although the first violin in the downward pressure on the pound was played not by the head of the Bank of England Mark Carney, but by two members of the English regulator who unexpectedly called for easing monetary policy. Traders were clearly discouraged by this fact, since the prospects of monetary policy have recently been discussed in a slightly different aspect. Experts discussed - will the BoE raise the rate in the first half of next year or will it still take a wait-and-see attitude? Now this discussion has been supplemented with one more question - will the English regulator resort to a preventive reduction in the rate?

The culprits of the bearish triumph were two members of the Committee - Michael Saunders and Jonathan Haskel. It is worth noting that Saunders is not the first to vote "against the grain", that is, contrary to the general opinion of most colleagues. A little over a year ago, he, along with Ian McCafferty, voted to raise the rate, while the remaining seven members of the Committee voted to maintain the status quo. This went on for three meetings, but then Saunders again joined the majority, voting in a general rhythm.

Now there is a mirror situation. Saunders and Haskel voted to reduce interest rates, violating the expected balance of power (0-2-7 instead of the predicted 0-0-9). For the first time in three years (that is, since August 2016), members of the Committee, albeit not in the majority, voted in favor of easing monetary policy. Moreover, Saunders and Haskell said that the regulator needs to introduce additional incentives as soon as possible, since recent releases indicate a weakening of the British labor market amid increasing risks from the global trade conflict.

The BoE did not support the peculiar "dissidents" in its conclusions, but also did not exclude the realization of such a scenario in the future. The rhetoric of the accompanying statement left a double impression. On the one hand, the English regulator made it clear that if global economic growth does not stabilize, Brexit uncertainty will continue, and key economic indicators will continue downward trend, then the central bank may have to intervene. But then the regulator hastened to declare the likelihood of an alternative scenario. If these risks do not materialize, then the issue of a gradual increase in the rate will again be on the agenda.

In other words, the prospects for monetary policy in the UK again depend on external factors. The Bank of England made it clear that it is ready to tighten monetary policy, but in the conditions of a "soft" Brexit and at least a conditional trade truce between the US and China. And of course, given the growth of key macroeconomic indicators in Britain, especially in the labor market and inflation.

Unfortunately for the GBP/USD bulls, the English regulator lowered its forecasts for the main economic indicators. So, GDP growth for the next year was reduced from 1.3% to the lowest level over the past ten years, 1.2%, and in 2021 - from 2.3% immediately to 1.8%. The BoE also lowered its inflation forecast - according to regulator members, its growth will slow by 1.2% by mid-2020, due to lower prices for black gold and regulatory restrictions on electricity and water tariffs.

Summing up the November meeting, Mark Carney confirmed that the central bank's next likely move would be a reduction in interest rates, as the Bank of England's updated economic forecasts were revised negatively. He also expressed concern that weak investment is detrimental to industrial production, thereby limiting the growth of the British economy and slowing inflation.

Nevertheless, it cannot be said that Carney announced a rate cut in the near future. He just did not rule out a similar scenario, linking it primarily with a possible "hard" Brexit and a general slowdown in the global economy. He voiced such rhetoric more than once, just in this case, Carney's position was reinforced by updated forecasts of the central bank of a negative nature. The two members of the Committee who voted in favor of lowering the rate only added fuel to the fire, putting additional pressure on the pound.

Thus, the November meeting of the Bank of England was by no means "passing". But despite the dovish tone of the regulator, the downward impulse of the GBP/USD pair was limited. Bears could not even gain a foothold in the 27th figure, and the price actually returned to its previous positions during the US session on Thursday. Apparently, traders are still tuned for a Conservative victory in December, and, accordingly, for the soft Brexit, with all the ensuing consequences.

Given this market reaction, it can be assumed that the GBP/USD pair will continue to trade flat, reacting violently only to political news. The pound turned out to be stress-resistant to dovish threats from the Bank of England, so the further dynamics of the pair will be determined only by the political prospects of the "divorce proceedings" between London and Brussels.

Analysis are provided by InstaForex
 
Control zones NZDUSD 11/11/19

The downward movement of the pair is impulsive, as the pair has gone beyond the average weekly movement. This indicates a high likelihood of continued fall and an update of the monthly low. Sales will be profitable after the pair returns to the broken middle course zone. The lower boundary of this zone is at the level of 0.6354.

Work in the downward direction will be a priority at the beginning of the new week. The first goal of the fall will be WCZ 1/2 0.6271-0.6265.

A strong increase in demand is required to break the downward momentum, which will lead to the closure of trading on Monday to be above Friday's Asian session. This will indicate the emergence of a major player interested in the appreciation of the New Zealand dollar.

Daily CZ - daily control zone. The area formed by important data from the futures market, which change several times a year.

Weekly CZ - weekly control zone. The zone formed by important marks of the futures market, which change several times a year.

Monthly CZ - monthly control zone. The zone, which is a reflection of the average volatility over the past year.

Analysis are provided by InstaForex
 
NZD / USD - change of priority

Good evening, dear traders! A rather rare event has occurred today: the NZD rate has not been lowered, although all the data and forecasts have indicated otherwise. The market expected a rate cut by 0.25 basis points, and as a result, the RBNZ decided to leave it at the same level. Of course, the event was unexpected at the moment, and the market reacted bullish: the NZD/USD currency pair will end the current day with strong growth. Therefore, the recommendation for this instrument is attempts to take a long position (buy), but only from a pullback.

Thus, I believe that on such a "positive" for the New Zealand currency, growth can be expected to continue from the morning impulse and the level of 0.6442 can be considered a possible target for growth - this is an important level for sellers who believe in this level as a resistance level. Now, after today's news, a very real prospect opens up to see at least a false breakdown of this level.

The level of 0.6369 is considered to be an intermediate level for the pullback - it would be interesting to see the pullback as such in its area.

I wish you all success in trading and great profits!

Analysis are provided by InstaForex
 
Forecast for EUR/USD on November 15, 2019


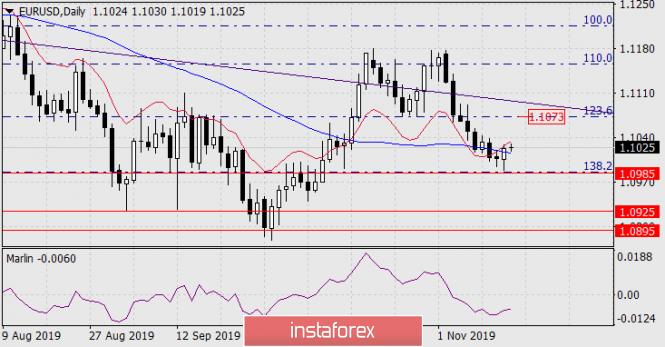
On Thursday, due to new difficulties in relations between the United States and China (China is resisting the signing of a clearly unprofitable trade agreement for it), investors chose to close their positions due to the uncertain economic data for Europe and the US that are coming out today, right before strong technical support (1.0985). The price exceeded the MACD line, the Marlin oscillator showed a reversal, but these are not yet sufficient conditions for significant growth, the situation is typical for correction. With the return of the price under the MACD line, the next wave of activity in euro sales is likely. We do not expect a correction above the Fibonacci level of 123.6% (1.1073).

analytics5dce2c00129a2.png


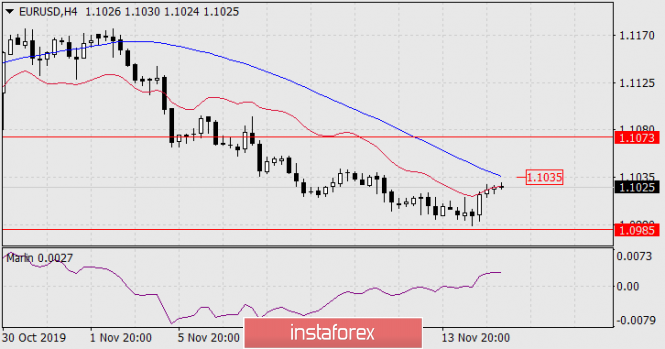
On the four-hour chart, the Marlin signal line entered the growth zone, while the price remains below the MACD line. The exit of the price above the line (1.1035) will allow the euro to develop a correction. This can be prevented by economic indicators; The eurozone trade balance for September is expected today to fall from 20.3 billion euros to 18.7 billion, US retail sales are projected to grow by 0.1% in October from -0.3% in September. Concern is caused by industrial production in the US for October, the forecast is -0.4%.

analytics5dce2c15e2456.png


So, after the correction is over, we are waiting for a new round of euro decline. Overcoming the first support at 1.0985 opens the way to the second goal 1.0925.


*The market analysis posted here is meant to increase your awareness, but not to give instructions to make a trade.
 
Control zones USDJPY 11/18/19

The pair tested the WCZ 1/2 108.48-108.38 last Thursday. Consolidation below the zone did not occur, therefore, the upward medium-term impulse remains a priority. The first growth target is the November high. Its achievement will make it possible to close part of the purchases and transfer the rest to breakeven.

Closing Friday trades made it possible to form an absorption pattern of the daily level, which confirms the bullish momentum.

Re-absorption of Friday purchases will be required to implement an alternative option. The probability of this is below 30%, which does not make it possible to consider sales. The main goal of the bullish impulse is the weekly control zone 110.15-109.94, which gives a favorable risk-to-profit ratio for any purchase made from current levels and below. Therefore, it is necessary to consider the possibility of adding to a long position.

Daily CZ - daily control zone. The area formed by important data from the futures market, which change several times a year.

Weekly CZ - weekly control zone. The zone formed by important marks of the futures market, which change several times a year.

Monthly CZ - monthly control zone. The zone, which is a reflection of the average volatility over the past year.

Analysis are provided by InstaForex
 
Pound breaks the rules of the game

The unwillingness of the Brexit Party to continue the struggle for seats in the renewed Parliament was the catalyst for the GBP/USD rally in the direction of the psychologically important mark of 1.3. In 2017, out of 43 seats now owned by Nigel Faraj's followers, 17 were held by the Conservatives, 11 by the Labour Party. The chances of the Tories' victory on December 12 are growing, and according to a poll by Bloomberg experts, their win will allow the pound to fly to $1.34. In such conditions, bulls will find it difficult not to fall into euphoria.

According to a Savanta ComRes poll, the Conservative Party has a 10-point lead over the opposition Labour. Studies by Ipsos Mori showed that 25% of respondents believe in the Tory victory, a third of respondents believe that Boris Johnson's supporters will lead the coalition in the new Parliament. The prime minister himself claims that Conservatives will end the uncertainty that is hampering Britain's economy. Indeed, weaker GDP growth than Reuters experts expected, job cuts, inflation slowdowns and disappointing retail sales statistics indicate that Great Britain is in pain from market uncertainties.

As a result, the 5% sterling rally for the last quarter runs counter to the principle of fundamental analysis "strong economy - strong currency". I would not be surprised if weak data on business activity in Britain lead to a continuation of the rally of the analyzed pair, because in this situation the chances of the Conservatives winning will increase.

Theoretically, the volatility, growing like a yeast, should also exert pressure on the pound. Due to the volatility of quotes, GBP has often been called the "Great British Peso" recently, comparing it with the currencies of developing countries. In fact, the current level of volatility suggests that after a month the sterling will either rise to $1.32, or fall to $1.25. The first option seems more plausible than the second. Pound Volatility Dynamics

The pound is able to restore the bullish trend before December, however, to begin with, it needs to be tested by the publication of the minutes of the October FOMC meeting and political debate. In his speeches at a press conference following the Federal Reserve meeting and before the US Congress, Jerome Powell put a high barrier to changing the rate on federal funds. Its current level of 1.75% is considered by the central bank as comfortable, and reduction is possible only in two cases: with the escalation of the trade conflict in Washington and Beijing and with a significant and prolonged deterioration of US macroeconomic statistics. As a result, the derivatives market believes that before the fall of 2020, changes in the monetary policy of the Fed should not be expected. If the minutes of the October FOMC meeting confirms this, the US dollar may receive some preferences.

Technically, the GBP/USD update of the October highs will increase the risks of continuing the upward campaign to the area of 1,322-1,327, where the Bat and AB = CD targets are located, as well as the Pivot levels. While sterling is trading above $1.2725-1.275, the situation is under the control of the bulls.

Analysis are provided by InstaForex
 
#USDX vs AUD / USD vs NZD / USD vs USD / CAD - H4. Comprehensive analysis of movement options for November 20, 2019 APLs & ZUP analysis

Minuette operational scale (H4) Commodity currencies - Here's a comprehensive analysis of the options for the development of the movement #USDX vs AUD / USD vs NZD / USD vs USD / CAD for November 20, 2019 on the Minuette operational scale forks (H4 time frame)

____________________

US dollar Index

The dollar index continues to remain in the 1/2 Median Line channel (97.65 - 97.92 - 98.15) of the Minuette operational scale forks, respectively, the further development of the #USDX movement from November 20, 2019 will be determined by the development and direction of the breakdown of the above levels. The details of the development are shown on animated chart.

The breakdown of the lower boundary of the 1/2 Median Line channel (support level of 97.65) of the Minuette operational scale forks - continuation of the downward movement #USDX to the equilibrium zone (97.40 - 97.15 - 96.92) of the Minuette operational scale forks.

On the contrary, in case of breakdown of the upper boundary of the 1/2 Median Line Minuette channel (resistance level of 98.15), the movement of the dollar index can be continued towards the goals: control line UTL (98.27) of the Minuette operational scale forks

- local maximum 98.45 - lower boundary of the ISL38.2 (98.50) equilibrium zone of the Minuette operational scale forks - 1/2 Median Line Minuette (98.87).

The markup of #USDX movement options from November 20, 2019 is shown on the animated chart.

____________________

Australian dollar vs US dollar

The development of the movement of the Australian dollar AUD / USD from November 20, 2019 will depend on the development and direction of the breakdown of the boundaries of the 1/2 Median Line channel (0.6812 - 0.6825 - 0.6842) of the Minuette operational scale forks. The details of the development of the boundaries of this channel are presented on the animated chart.

The breakdown of the resistance level of 0.6842 at the upper boundary of the 1/2 Median Line Minuette channel is the continuation of the movement of the Australian dollar to the upper boundary of the 1/2 Median Line channel (0.6855) of the Minuette operational scale forks and the equilibrium zone (0.6865 - 0.6890 - 0.6915) of the Minuette operational scale forks.

However, in the event of a breakdown of the lower boundary of the 1/2 Median Line channel (support level of 0.6812) on the Minuette operational scale, it will be possible to continue the downward movement of AUD / USD to the targets: the initial SSL Minuette line (0.6785) - local minimum 0.6770 - LTL Minuette control line (0.6760) - upper boundary ISL38.2 (0.6745) of the equilibrium zone of the Minuette operational scale forks.

From November 20, 2019, we look at the layout of the AUD / USD movement options on the animated chart.

____________________

New Zealand dollar vs US dollar

From November 20, 2019, the development of the movement of the New Zealand dollar NZD / USD will be determined by the development and the direction of the breakdown of the range :

resistance level of 0.6415 on the control line UTLof the Minuette operational scale forks;
support level of 0.6395 at the upper boundary of the 1/2 Median Line channel of the Minuette operational scale forks.

The breakdown of the UTL control line (resistance level of 0.6415) of the Minuette operational scale fork will determine the continuation of the development of the upward movement of NZD / USD to the equilibrium zone (0.6450 - 0.6475 - 0.6500) of the Minuette operational scale fork.

In contrast, the breakdown of support level of 0.6395 will cause the movement of the New Zealand dollar to continue in the 1/2 Median Line channel (0.6395 - 0.6380 - 0.6360) of the Minuette operational scale forks, and if the breakdown of the lower boundary (0.6360) of this channel takes place, then the downward movement of this currency instrument can continue goals: local minimums (0.6330 - 0.6318) - control line LTL Minuette (0.6300) - 1/2 Median Line channel (0.6275 - 0.6230 - 0.6185) of the Minuette operational scale forks.

From November 20, 2019, we look at the layout of the NZD / USD movement options on the animated chart.

____________________

US dollar vs Canadian dollar

Similarly, the development of the movement of the Canadian dollar USD / CAD from November 20, 2019 will also be due to the development and direction of the breakdown of the range :

resistance level of 1.3210 at the lower boundary of ISL38.2 equilibrium zone of the Minuette operational scale forks;
support level of 1.3200 at the upper boundary of the ISL38.2 equilibrium zone of the Minuette operational scale forks.

The breakdown of ISL38.2 Minuette (support level of 1.3200) will make the development of the Canadian dollar to continue in the equilibrium zone (1.3200 - 1.3180 - 1.3160) of the Minuette operational scale forks followed by the continuation thereof in the 1/2 Median Line channel (1.3160 - 1.3130 - 1.3100) of the Minuette operational scale forks.

On the contrary, the breakdown of ISL38.2 Minuette (resistance level of 1.3210) - the development of the USD / CAD movement in the equilibrium zone (1.3210 - 1.3252 - 1.3295) of the Minuette operational scale forks, taking into account the development of the SSL initial line (1.3262) of the Minuette operational scale forks and the local maximum 1.3270.

____________________

The review is made without taking into account the news background. Thus, the opening of trading sessions of major financial centers does not serve as a guide to action (placing orders " sell " or " buy ")

The formula for calculating the dollar index:

USDX = 50.14348112 * USDEUR0.576 * USDJPY0.136 * USDGBP0.119 * USDCAD0.091 * USDSEK0.042 * USDCHF0.036.
where the power coefficients correspond to the weights of the currencies in the basket:
Euro - 57.6%;
Yen - 13.6%;
Pound Sterling - 11.9%;
Canadian dollar - 9.1%;
Swedish Krona - 4.2%;
Swiss franc - 3.6%.

The first coefficient in the formula leads the index to 100 at the start date of the countdown - March 1973, when the main currencies began to be freely quoted relative to each other.

Analysis are provided by InstaForex
 
Trading idea for the AUD/USD pair

Good evening, dear traders! The growth of AUD / USD is what is interesting today. As we remember, unemployment data was published in Australia last week on November 14, to which this instrument reacted negatively: the AUD/USD currency pair was declining throughout the whole day. An important detail is that during the fall, an important extreme at 0.6810 was updated. Thus, I believe that this was a culmination of the downward trend in November, and given the reaction of the Australian dollar to this week's news, I think that local growth is possible to the level of 0.6843, which is the news' high on Wednesday. Now, why exactly this level? It's simple - every seller who believes in a further fall of this instrument will clearly depend precisely on the news impulse on November 14, so the price can go there with a high degree of probability.

Recommendation: try to buy in order to update the level of 0.6943. At the same time, losses can be limited to the lowest level of 0.6788 - there is no sense in holding purchases below, and in case of updating this minimum, the bullish scenario can be considered invalid.

Wishing you all success in trading and huge profits!

Analysis are provided by InstaForex
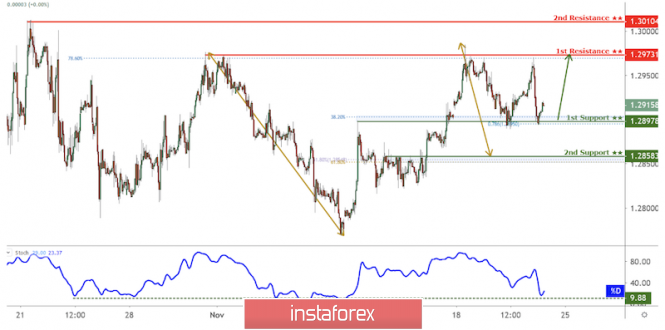
 
GBP/USD approaching support, potential bounce!


Price is approaching our first support where we are expecting a bounce above this level.

Entry: 1.28978

38.2% Fibonacci retracement, 78.6% Fibonacci extension, horizontal overlap support

Take Profit : 1.29731

Why it's good : 78.6% Fibonacci retracement, horizontal swing high resistance


analytics5dd75b1839761.png


*The market analysis posted here is meant to increase your awareness, but not to give instructions to make a trade.
 
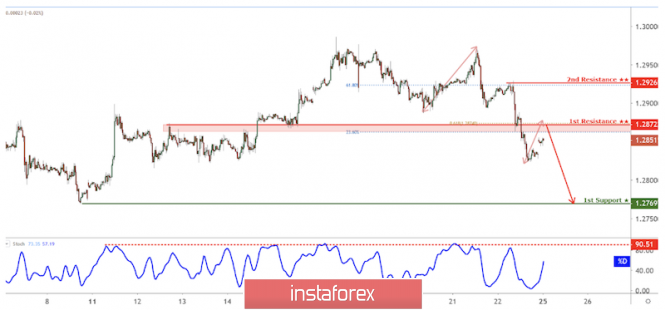
GBP/USD approaching resistance, potential drop!

analytics5ddb48d26a074.png


Price is approaching our first resistance a 1.28722 where we are expecting a drop to our first support level at 1.27697.

Entry: 1.28722
23.6% Fibonacci retracement, 61.8% Fibonacci extension, horizontal overlap resistance
Take Profit : 1.27697
Why it's good : horizontal swing low support

Analysis are provided byInstaForex.
 
Developing USD/CAD pair and trading idea

During the previous recommendation on Friday,it is advised to develop the pair at least on a false breakdown of the level of 1.3269. Actually, this is exactly the outcome we are observing - on the news, this level was falsely broken, and thus, the recommendation completely justified itself. The plan was this:

Thus far, the intrigue of the instrument continues. False news breakdown of this level provides a good opportunity for the development of further medium-term upward trend. Since the end of October, there has been a prolonged upward trend on for this instrument, and the probability of its continuation is still high. For this reason, there is another recommendation for the same instrument today. I believe that the development will continue to a minimum to the level of 1.3326. Therefore, you can try to buy with a goal of updating it, limiting the risks at the price of 1.3254, since it makes no sense to keep purchases below the news last Friday. Updating Friday's minimum - the bullish scenario will be completely canceled.

Wishing you all success in trading and huge profits!

Analysis are provided by InstaForex
 
Take profit on AUD/USD pair

Good evening, dear traders! Congratulations to those who took advantage of our trading idea for the AUD/USD pair, which was provided last November 25.

Let me remind you that the idea was to develop the lower daily area in a downward trend:

As you can see, the first goal is taken:

The collapse did not follow, so I recommend taking profits.

Good luck in trading and see you tomorrow morning!

Analysis are provided by InstaForex
 
Why didn't the oil go upwards? Volume analysis for oil

Good evening, dear traders! Yesterday, we gave a trading idea for the growth of oil but paid attention to the evening news on oil reserves in the United States. Let's analyze this situation on volumes.

During the time of the opening of Europe, the price immediately went up and while it is on the way to the maximum of 58.74, there was another extremum - 58.56. At the breakdown of which, there was practically no doubt about the further increase in price. Looking at the chart, even the trend line up indicates purchases. However, It is very important that all this happened in the middle of the European session and before the release of the weekly news on Oil Reserves for about another 5 hours. That is, everyone only sees purchases.

At the time of the opening of the American session, there was also no increase in prices. Although the upward trend still remained, which added confidence in the growth.

In addition, at the time of the news release, summing up all mentioned above, the state of the price was such that all liquidity was not up, but, on the contrary, at the bottom with the nearest targets 58.13 and the American session of the previous day which is 57.76.

Oil's approach to the maximum in Europe:

Thus, the Europeans simply didn't have the courage to collect stocks before the reserves. Nevertheless, the stocks themselves came out large, which led to the sales of black gold.

This analysis is based on the US oil futures.

Analysis are provided by InstaForex
 
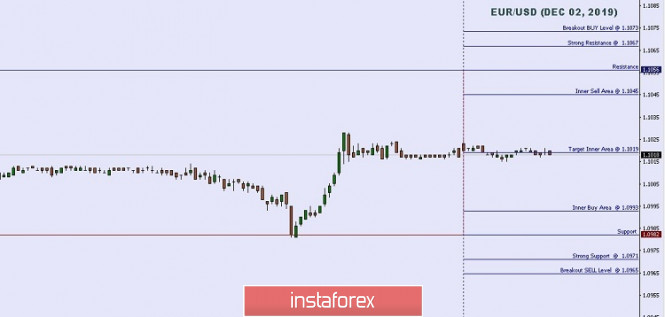
Important intraday Level For EUR/USD, December 02,2019

analytics5de47d010f1c0.jpg


When the European market opens, such economic data as Final Manufacturing PMI, German Final Manufacturing PMI, Italian Manufacturing PMI, French Final Manufacturing PMI, and Spanish Manufacturing PMI will be unveiled. The US will publish such eocnomic reports as ISM Manufacturing Prices, Construction Spending m/m, ISM Manufacturing PMI, and Final Manufacturing PMI.So, amid the reports, EUR/USD will move in a low to medium volatility during this day.

TODAY'S TECHNICAL LEVEL:

Breakout BUY Level: 1.1073.

Strong Resistance: 1.1067.

Original Resistance: 1.1056.

Inner Sell Area: 1.1045.

Target Inner Area: 1.1019.

Inner Buy Area: 1.0993.

Original Support: 1.0982.

Strong Support: 1.0971.

Breakout SELL Level: 1.0965.


(Disclaimer) *The market analysis posted here is meant to increase your awareness, but not to give instructions to make a trade.
 
Control zones for USD/CAD on 12/03/19

During the second week, the pair is trading within the accumulation zone. This makes it possible to consider weekly extremes for finding entry points. The upper boundary is the maximum of the last week, which coincides with the Weekly Control Zone 1/2 1.3328-1.3319. Now, testing this zone will be decisive for the entire upward movement of the last month.

Working within the framework of the flat implies partial consolidation of transactions during tests of significant extremes.

An alternative model will be developed if the closure of today's trading occurs above the Weekly Control Zone 1/2. This will open the way for further growth. The nearest goal, in turn, will be the maximum of October. The test of which will increase the probability of a large offer.

Daily CZ - daily control zone. The zone formed by important data from the futures market that changes several times a year.

Weekly CZ - weekly control zone. The zone formed by the important marks of the futures market, which change several times a year.

Monthly CZ - monthly control zone. The zone that reflects the average volatility over the past year.

Analysis are provided by InstaForex
 
Oil kings can do everything?

Oil is slowly recovering from a major sell-off on the last day of autumn. Taking advantage of the thin market after Thanksgiving, speculators decided to get rid of their long positions ahead of the December OPEC+ meeting. The simplest thing that the cartel and Russia can do is to prolong the agreement to reduce production by several months after March 2020. However, how will the market react to this? Isn't it better to avoid a massive sell-off before the results of the meeting are known?

If speculators sold oil at the November 29 auction, before that, on the contrary, they were actively building up long positions. By the end of the week, November 26, WTI net-longs increased by 15%, gross longs increased by 12%, while shorts fell by 14%. Approximately the same numbers could be seen on Brent.

Brent Speculative Dynamics

It is peculiar that black gold was not moving in unison with US stocks at the turn of autumn and winter. The latter were marked by a serious collapse after the White House introduced duties on imports of steel and aluminum from Brazil and Argentina, while oil grew in response to rumors of Saudi Arabia's desire to expand production cuts from 1.2 million bpd to 1.6 million bpd, at least until June 2020. Riyadh needs to carry out an initial public offering of shares in the state-owned company Aramco, the scale of which is estimated at approximately $25 billion. If Brent is listed below $60 per barrel, it is unlikely that buyers will grab paper of the oil company like hotcakes.

However, according to Goldman Sachs, even if OPEC+ expands its obligations by 400 thousand bpd by the end of June 2020, this is unlikely to lead to a serious increase in prices. The bank predicts that North Sea-grade quotes will dangle around $60 per barrel for most of next year.

Oil support is provided by the first growth above the critical level of 50 in business activity in China's manufacturing sector since April. China is the largest consumer of black gold in the world, and an increase in demand of 64 thousand bpd in the third quarter is good news for Brent bulls and WTI. Moreover, the IEA predicts that the figure will reach a record high of 13.6 million bpd in 2020. I have no doubt that this will be so if the trade war between Washington and Beijing does not become history. Otherwise, weak global demand will continue to put downward pressure on black gold prices.

At the same time, the growth of shale production in the United States significantly affects the market balance. In September, the United States closed a full month as a net exporter of black gold for the first time since 1940. Its deliveries abroad exceeded imports by 89 thousand bpd. It is Interesting that the last time the value of net imports exceeded 12 million was ten years ago.

Technically, without leaving Brent quotes beyond the downward trading channel, the implementation of the Double Bottom pattern can be forgotten. On the contrary, a breakthrough of support at $56 per barrel, which corresponds to the lower boundary of the triangle, the risks of a downward trend recovery will increase.

Analysis are provided by InstaForex
 
Forecast for USD/JPY on December 5, 2019

USD/JPY

The information received yesterday from the headquarters of the US and Chinese negotiators on trade encouraged the markets - representatives of the parties allowed the conclusion of the first phase of the deal until December 15, before the date of the introduction of tariffs on Chinese goods. The US S&P 500 index gained 0.63%, Nikkei 225 is currently up 0.70% and China A50 grew 0.36%. The price turned from the achieved first bearish goal - from the enclosed line of the price channel, a little short of the MACD line. The signal line of the Marlin oscillator is still in the negative trend zone, growth could continue, but still within the correction.

The correction can continue to the range of 109.30/50 (highs of October 30 and November 7), going over the range will mean the correction will go into a trend growth, the target will be the line of the green price channel in the region of 109.95. Leaving prices at yesterday's low opens the next bearish target at 107.57 - the intersection of the lines of the red and green price channels.

*The market analysis posted here is meant to increase your awareness, but not to give instructions to make a trade.

Analysis are provided by InstaForex
 
Developing the trading idea for oil

Good evening, dear traders! I present to you the development of a trading idea for oil based on volumetric analysis!

Let me remind you that the idea for purchasing oil for the absorption of the decline last Friday was presented yesterday (12/04/19), which happened without the participation of America, because they had a public holiday. After that, the Americans traded for the next 2 trading sessions at prices that were not very profitable for sales, i.e. cheap relative to prices before the holidays.

The price increase occurred before the news on Oil Reserves, but this also increased the probability of a maximum update, since oil production was sharply reduced and today, there was an opportunity to add long positions in order to update the last maximum of 58.74.

As a result, 250 points were earned from the entry point 56.30 to the crossing 58.74. Moreover, it would bring +60 points when adding a long position or purchasing from oil reserves.

Forecast:

Developing trading idea with a description:

Good luck in trading and follow the money management!

*The market analysis posted here is meant to increase your awareness, but not to give instructions to make a trade.

Analysis are provided by InstaForex
 
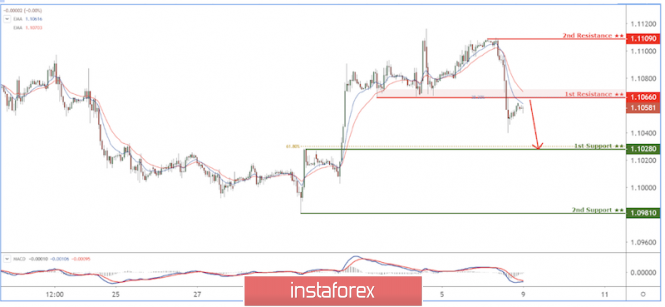
EUR/USD reacting below resistance, potential drop!


analytics5dedb74f83c24.png


Trading RecommendationEntry: 1.10660Reason for Entry: 38.2% Fibonacci RetracementTake Profit : 1.10280

Reason for Take Profit: 61.8% Fibonacci retracementStop Loss: 1.11090Reason for Stop loss:

horizontal swing high resistance


(Disclaimer) *The market analysis posted here is meant to increase your awareness, but not to give instructions to make a trade.
 
Back
Top