Wave Analysis from InstaForex

Forecast for EUR/USD on June 12, 2023

EUR/USD
The euro is approaching the support level at 1.0738. The Marlin oscillator has backed off from attacking the zero line and has turned around as it approaches it. On the euro's path towards the target at 1.0600, there are at least three strong support levels: the nearest ones are at 1.0738, 1.0716, and 1.0692. There are no major macroeconomic news today, but tomorrow's important event will be the release of the May CPI in the US, and forecasts already suggest a slowdown in inflation (4.9-5.0% YoY compared to April's 4.9% YoY, although the range of forecasts varies depending on the analytical agency and individual groups of economists).

analytics648685ed04d17.jpg


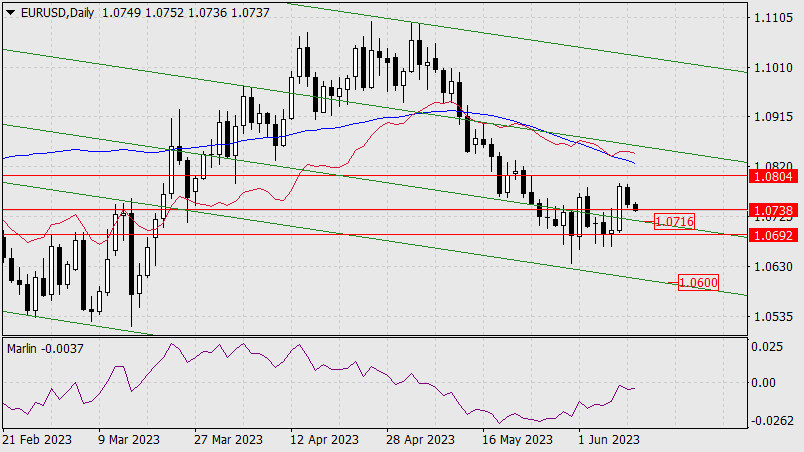
The yield on US government bonds is not decreasing and remains at the peaks of June 7-9, technically leaning towards growth. This sentiment is also felt in gold, which has declined in value for the second consecutive day. The market probability of a rate hike on Wednesday has slightly increased from 25.3% to 29.9%. If tomorrow's CPI data does exhibit growth, investors will significantly raise this probability, and the markets will psychologically be prepared for an actual rate hike. Today, the volatility is likely to be low, and the day's close will be slightly lower.

analytics648685dc058da.jpg


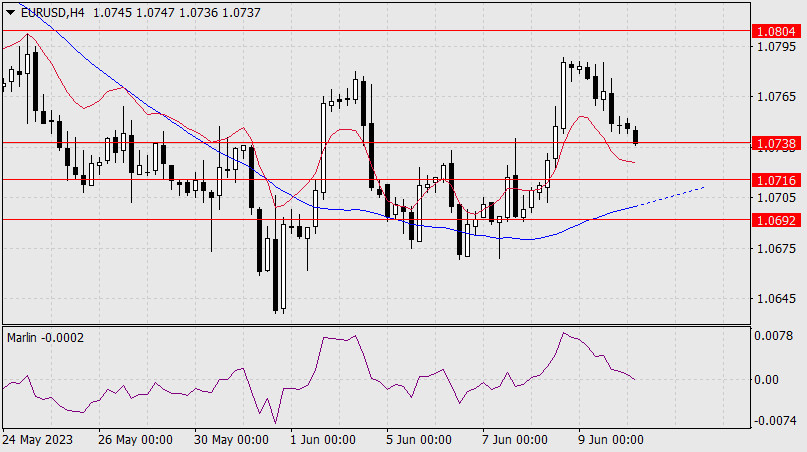
On the four-hour chart, the signal line of the Marlin oscillator is approaching the zero line and may meet it when the price touches 1.0738. Afterwards, we expect the price to move sideways.

Analysis are provided by InstaForex.

Read More
 
Forecast for EUR/USD on June 13, 2023

EUR/USD
The euro chose to wait within the range of 1.0738-1.0804 ahead of the Federal Reserve meeting, rather than the previously anticipated range of 1.0692-1.0738. Technical indicators in the new range feel more at ease, with the Marlin oscillator approaching the neutral zero line.

However, this calmness is likely to be disrupted. The ZEW Economic Sentiment Index for the eurozone is projected to worsen from -9.4 to -11.9 in June. The evening will bring the main event of the day - the release of US CPI data. The consensus forecast suggests a decline in the overall index from 4.9% YoY to 4.1% YoY, and a decrease in the core index from 5.5% YoY to 5.3% YoY. The projected decline in inflation is optimistic, but at the moment, we consider it a secondary factor. If the Fed intends to raise interest rates, then weak data will be released, as inflation, like employment, are heavily manipulated fundamental indicators in the US.

We see a slight discrepancy between market expectations and the Fed's stance on interest rates, which is quite understandable, as rate hikes strongly impact businesses, and the market needs a confirmation of the rate hike, as it has been ignoring verbal signals from FOMC members given previously, as well as rate hikes by other central banks. Yesterday, investors increased the probability of a 0.25% rate hike to 30%. However, this is not enough, so the signal must be more specific, which is expected to be provided by today's inflation data published by the US Bureau of Labor Statistics. If CPI data does not come out poorly, uncertainty about the interest rate will become particularly high.

The situation is neutral on the four-hour chart. The price is developing above the balance and MACD indicator lines, but the Marlin oscillator is attempting to move into negative territory. We await further developments. Target levels are marked on the chart.

Analysis are provided by InstaForex

Read More https://ifxpr.com/3CnNGlE
 
Technical Analysis of Intraday Price Movement of Crude Oil Commodity Asset, Wednesday June 14, 2023

With the appearance of deviations between price movements and the MACD indicator on the 4-hour chart - Crude Oil commodity assets, in the near future #CL has the potential to appreciate corrected rally upwards to test the Bearish Orderblock level at 70.62 as the main target and if the momentum and volatility are sufficiently supportive, it is not impossible that the 200 EMA will be the next target to aim for provided that on the way to these targets it does not occur #CL returns to its initial bias again especially not to break below the 67.92 level because if this level is successfully broken then the scenario of an upward correction above that has been described will become invalid and cancel by itself.

Analysis are provided by InstaForex

Read More https://ifxpr.com/3NsBKFP
 
Forecast for AUD/USD on June 15, 2023

AUD/USD So, the US inflation data on Tuesday and yesterday's Federal Reserve meeting pushed the locally overbought Australian dollar above the target level of 0.6810. Since this level is strong, yesterday's growth corresponds to the overall market movement, and this morning we can see that the price has slightly fallen from the resistance level.

The Marlin oscillator is turning downwards on the daily chart, but clearly, the price needs external support. We are waiting for the market's reaction to the results of the European Central Bank meeting today. We will learn about further growth if the price consolidates above 0.6810 (target 0.6873), and a break of the ascending trend will be indicated by the price breaking below the support level of 0.6730.

On the 4-hour chart, the Marlin oscillator is moving sideways in a narrow range, which is a sign of a downward breakout of this range. The price needs to overcome yesterday's low at 0.6759. After that, we can expect the price to attack 0.6730, where the MACD indicator line is approaching and strengthening it.

Analysis are provided by InstaForex

Read More https://ifxpr.com/3CsRJNR
 
Forecast for GBP/USD on June 16, 2023

GBP/USD:
On Thursday, the pound rose by 120 pips, reaching the target level of 1.2785. Consolidation above this level will make it possible for the pair to reach the next target at 1.2870. The subsequent targets are at 1.2980/90, and so on, every hundred pips. Yesterday, the pair surpassed the peak of May 10, which marked the highest point of growth since September 2022. As a result, the market has started a trend, and the decline observed from May 10 to May 25 was merely a correction within this annual uptrend.

analytics648bd294d13f2.jpg


Considering the fundamental factors and the disbelief in the pound's long-term growth, the current year-long growth can be interpreted as a correction from a more significant decline between May 2021 and September 2022 (69 weeks). Currently, this is the 37th week of growth. It may continue for another three weeks and the pound can reach the level of 1.3160, the December 2021 low.

analytics648bd2875517c.jpg


We are extremely cautious about the prospect of such growth. Right now the Marlin oscillator is already showing signs of a reversal from the overbought territory.

On the 4-hour chart, there are no clear reversal signals, although the oscillator is in the overbought territory. The pound has a good chance of surpassing the 1.2785 level, and it will try to reach the 1.2870 target.

Analysis are provided by InstaForex.

Read More
 
Forecast for EUR/USD on June 19, 2023

EUR/USD:
On Friday, the euro fell by 5 pips, reaching the upper shadow of the April 4th peak. This level is not very strong, but after testing the stronger target range of 1.0910/30, a reversal could occur from a weaker level. If the price surpasses Friday's high (1.0971), the price will try to test the upper limit of the price channel around 1.1013. The daily Marlin oscillator is turning downward, indicating that the euro will likely try to return below the range of 1.0910/30. Consolidation below this range would allow for a bearish push towards the lower embedded line of the price channel around 1.0840.

On the four-hour chart, there is a price consolidation above the target range of 1.0910/30, indicating a desire for further upward movement. The Marlin oscillator will also turn upward, easing the oversold condition. However, if the euro has no intention of rising, once the price falls below the mentioned range, it will consolidate below the zero line along with the oscillator, as its decline is quite rapid. The support level at 1.0840 approximately corresponds to the MACD line on the four-hour chart. The same indicator line on the daily chart is also approaching this area.

The support is becoming stronger, and its significance is increasing day by day. Therefore, breaking below this level would be a definitive signal for the development of medium-term downward movement (1.0580).

Analysis are provided by InstaForex

Read More https://ifxpr.com/43K1LpD
 
Forex Analysis & Reviews: Forecast for EUR/USD on June 20, 2023

EUR/USD
Yesterday, the euro fell by 18 pips, marking the lower limit of the target range at 1.0910/30 with its lower shadow. Consolidation below the range will allow for an advance towards the lower line of the price channel around the 1.0840 mark. However, the signal line of the Marlin oscillator is falling sluggishly, indicating that the euro still has a potential to rise. At the same time, the price is above the balance indicator line (which also halted its decline yesterday), indicating a maintained upward potential along with Marlin.

The situation could be reversed by a strong downward movement surpassing yesterday's level. This is possible if the US construction data turns out to be good and today's speeches by James Bullard and John Williams demonstrate firmness, hinting at Federal Reserve Chairman Jerome Powell's stance in his key speech in the House of Representatives tomorrow.

On the four-hour chart, the signal line of the Marlin oscillator sharply declines in a straight line. This often indicates a reversal of the price upwards. If the price finds the strength to break below the MACD line, the upward reversal is either postponed until the completion of a deep correction or canceled. The price is about 65 pips away from the MACD line, and an additional 15-20 pips would be needed for confirmation below it, which may prove to be an unattainable task for today. Powell's speech will take place in 9 four-hour candles (green vertical line). If the price does not deviate from its plan, it will only need to cover 50 pips since the MACD line is rising and approaching the price. The ultimate signal level is the peak on June 14 at 1.0865. The task is achievable, but the first impulse is necessary. The main plan will be canceled if the price breaks above the peak on June 16, allowing the price to continue rising towards 1.1007.

Analysis are provided by InstaForex

Read More https://ifxpr.com/3XjznIO
 
Forecast for GBP/USD on June 21, 2023

GBP/USD
Yesterday, the British pound settled below the linear resistance at 1.2785. The Marlin oscillator's signal line is declining, inspiring the British pound not to hesitate in reaching the target support level at 1.2678. However, the price needs a good reason - a slowdown in the inflation report from the National Statistics Office. The forecast for the CPI is expected to be 8.5% YoY, compared to April's 8.7% YoY. If the data shows that inflation is getting stronger, the price may try to reach the target level of 1.2870.

On the 4-hour chart, the price found support from the balance line (red indicator). This hints at investors' desire to maintain an upward situation, as the Bank of England is expected to raise the interest rate by 0.25% tomorrow, with its planned four more rate hikes by the end of the year, totaling 5.75%. This would align with the Federal Reserve's interest rate by the end of the year (assuming two rate hikes by the Fed by year-end).

From a technical perspective, the price should settle below the MACD line, below 1.2723, if it intends to make at least a false downward movement. For a more confident decline, the price should establish itself below 1.2678.

Analysis are provided by InstaForex

Read More https://ifxpr.com/43OKfkl
 
Forecast for GBP/USD on June 22, 2023

GBP/USD:
Yesterday, the British pound traded within a range of 110 pips, closing the day with a 5-pip increase. Such volatility allowed the price to hold below the resistance level of 1.2785 and the Marlin oscillator to stay in a downward direction. Today, the price has a chance to retest the support level of 1.2678 and, if successful, it may fall towards 1.2600.

Consolidation above 1.2785 would allow the price to continue rising according to an alternative scenario towards the level of 1.2870. The next target is 1.2940. On the four-hour chart, we can see that the price's failure to consolidate below the MACD indicator line has brought the price back above this line, but now with consolidation. The Marlin oscillator is in negative territory, so there is a possibility of another attempt to break downward.

Today, the Bank of England will make a decision on monetary policy, and a 0.25% rate hike is expected. However, consulting agencies suggest that this increase is already priced in, so investors will focus on the central bank's further plans.

Analysis are provided by InstaForex

Read More https://ifxpr.com/3Xs4VMv
 
Forecast for GBP/USD on June 23, 2023

GBP/USD
Despite the Bank of England's decision to raise the base rate by 0.50% instead of the expected 0.25%, the British pound closed the day down by 22 pips. The unexpected decision sparked UK recession concerns. With inflation remaining at 8.7% YoY and the rate increased to 5.00%, the economy is experiencing a situation of economic contraction and reduced consumer demand (and inflationary pressure!). The UK finds itself in this trap for the second time, with the first time being during the global crisis of 2008/2009, when the rate was also raised to 5.00% and inflation was at 5.0% YoY.

Today, retail sales data for May in the UK will be released, with a forecast of -0.2%. The forecast for core retail sales is -0.3%. The decline in retail sales to -3.0% YoY currently corresponds to the contraction seen during the 2008 crisis, and the March figure of -3.9% is even worse than those years.

So, the price failed to extend yesterday's rally, and the breakthrough above the resistance at 1.2785 turned out to be false for the third consecutive session. Now, the price is declining towards the nearest support at 1.2678. Breaking this level will open up the next target at 1.2600.

On the 4-hour chart, the price has consolidated below the balance and MACD indicator lines, and the Marlin oscillator is in negative territory. The short-term trend is bearish. To confirm a medium-term decline, the price needs to consolidate below the MACD line on the daily chart (1.2510).

Analysis are provided by InstaForex

Read More https://ifxpr.com/3XmuSgm
 
Forecast for USD/JPY on June 26, 2023

USD/JPY:
Last Friday, the Japanese yen entered the 143.20/80 range and has been consolidating within it until this morning. On the daily chart, a divergence has not yet formed between the price and the Marlin oscillator. Keeping the price within the current range increases the chances of a subsequent decline. If the dollar continues to rise, then after surpassing 143.80, the 144.73 target will just be within reach.

Falling below 143.20 would indicate that the dollar cannot continue to rise without a corrective pause, and the 142.30 target will open up. Moreover, if the price breaches the support level, it would mean a break below the embedded line of the price channel, potentially leading to sideways movement for a few days before further upward movement.

On the four-hour chart, the pair is accelerating its growth. The Marlin oscillator is not yet in the overbought zone, so there is a good chance for the price to reach 144.73 in the near future before the growth loses momentum. As the probability of further growth and correction is roughly equal, the key levels to watch are 143.20 and 143.80.

Analysis are provided by InstaForex

Read More https://ifxpr.com/3PtGAUA
 
Technical Analysis of GBP/USD for June 27, 2023

Technical Market Outlook:
The GBP/USD pair has hit the technical support located at the level of 1.2698 and the bulls keeps trying to bounce higher to resume the up trend. The local low was made a few pips lower at 1.2684 and will act as the intraday technical support. The 50 MA will provide the dynamic resistance for bulls around the level of 1.2766 when the up trend is resumed. The weak and negative momentum on the H4 time frame chart support short-term bearish outlook for GBP, but the bulls keep trying to move up. The pull-back might evolve into a full-blown correction if the level of 1.2684 is broken.

Weekly Pivot Points:
WR3 - 1.27656
WR2 - 1.27471
WR1 - 1.27367
Weekly Pivot - 1.27286
WS1 - 1.27182
WS2 - 1.27101
WS3 - 1.26916

Trading Outlook:
The 61% Fibonacci retracement located at the level of 1.2778 has been hit, but it does not indicate the corrective cycle to the upside had been terminated. Any sustained breakout above this level and a weekly candle close above it is needed to change the long-term outlook to bullish. The key long term level of technical support is seen at 1.2444. The next long-term target for bulls is seen at the level of 1.3160.

Analysis are provided by InstaForex

Read More https://ifxpr.com/3NP4qZF
 
Forecast for EUR/USD on June 28, 2023

EUR/USD:
On Tuesday, European Central Bank President Christine Lagarde, at a conference in Portugal, stated with full confidence that the peak rates have been reached, which briefly stimulated the euro's growth. Chinese banks were selling the dollar yesterday, indirectly supporting the euro. The pair rose by 54 points and reached the intermediate level of 1.0971 on the way to 1.1000.

The Marlin oscillator is currently turning downwards, and if the euro does not receive any more external support, the correction may end. Today, Federal Reserve Chair Jerome Powell is also speaking at the same conference in Portugal, and he could say something in favor of the dollar. If not, the price will continue to rise towards the corrective target at 1.1000. If the price surpasses this level, it will continue to rise towards targets at 1.1028 and 1.1085.

On the 4-hour chart, the price is entangled in indicator lines and has not yet fully figured out its relationship with the 1.0971 level. The Marlin oscillator only moved into positive territory yesterday, feeling fresh and ready to assist in further price growth. Falling below the target range of 1.0910/30 will restore the decline in the medium term, which started on June 22. The target is 1.0804.

Analysis are provided by InstaForex

Read More https://ifxpr.com/46nJnVs
 
Forecast for EUR/USD on June 29, 2023

EUR/USD
Yesterday, the euro returned to Tuesday's lows, which can be considered as the end of the confrontation amid aggressive rhetoric from central bank officials at the forum in Sintra. Federal Reserve Chairman Jerome Powell confirmed the possibility of rate hikes at consecutive meetings, and investors, comparing economic data that is clearly better in the United States than in Europe, started buying dollars.

The price has already broken below the lower band of the target range of 1.0910/30 and opened the target of 1.0789-1.0804, towards which the MACD indicator line on the daily chart will soon approach. The lower band of the target range is defined by the low of April 3. The Marlin oscillator is declining.

On the four-hour chart, the price has settled below the balance indicator line, and the Marlin oscillator has settled below the zero line. We have a downtrend, and we are waiting for the price to reach the target range.

Analysis are provided by InstaForex

Read More https://ifxpr.com/435CUf1
 
Forecast for EUR/USD on June 30, 2023

EUR/USD: Yesterday, thanks to the report on the final estimate of US GDP for the first quarter, which turned out to be better than expected, the US dollar strengthened by 0.35%. The euro lost 47 pips. On the daily chart, the price settled below the range of 1.0910/30. Now the price can reach the target range of 1.0789-1.0804.

The MACD line is approaching this range, increasing its importance. Consolidating below this range will be a key indicator of the euro's medium-term uptrend. Around the same time, the Marlin oscillator will move into negative territory.

On the four-hour chart, the Marlin oscillator signal line stayed within the downtrend area yesterday. The price briefly moved above the range and the balance line. We expect further developments within the support range of 1.0789-1.0804.

Analysis are provided by InstaForex

Read More https://ifxpr.com/3rfoWK0
 
Forex Analysis & Reviews: Forecast for GBP/USD on July 3, 2023

GBP/USD
On Friday, the GBP/USD pair rose above the target level of 1.2678. The signal line of the Marlin oscillator turned upwards from the zero line. Now, if the pair closes the day above this level, it will continue to rise towards the next resistance level at 1.2785. Closing the day below 1.2678 will extend the period of uncertainty since the US will be celebrating a holiday tomorrow.

According to the main scenario, the price is trading towards the target support level at 1.2520, where the MACD line is currently located. This would automatically lead to a break below the embedded green price channel line (1.2572), which is a sign of medium-term decline. The pair will likely go through light trading today and tomorrow, due to the US holiday, and major events will unfold on Wednesday.

On the four-hour chart, the price is staying above 1.2678, and the first resistance it encounters is the balance indicator line. Marlin is rising in the positive territory. There is a possibility of further growth towards the MACD line (1.2760) and then 1.2785. Currently, time is working in favor of the bears. If the price fails to firmly establish above 1.2678 or reverses downwards, it may lead to a two-day period of uncertainty (range).

Analysis are provided by InstaForex

Read More https://ifxpr.com/3NWKowt
 
Forecast for EUR/USD on July 4, 2023

EUR/USD
Yesterday, the euro showed a range of 60 points, closing the day at the opening level. The upper shadow tested the 1.0930 level, and this morning the price is headed towards this mark again, not giving up hope of reaching the upper band of the green descending price channel around 1.0990. This is possible if the euro follows the stock market and employment data turn out worse than expected. For now, the price needs to consolidate above 1.0930. Surpassing yesterday's low at 1.0871 will be a signal for a decline.

On the 4-hour chart, the price could not consolidate below the balance indicator line and returned to the 1.0910/30 range. Here, it can linger for a while and try to overcome the MACD line around 1.0952. The Marlin oscillator in the positive area is ready to join the growth at any moment.

Given that we accept the bearish scenario for the euro as the main plan, the price may not overcome the MACD line and return below the range. Like yesterday, uncertainty persists in the short-term perspective.

Analysis are provided by InstaForex

Read More https://ifxpr.com/3CY8DnH
 
Forecast for EUR/USD on July 5, 2023

EUR/USD
The euro lost more than 30 points yesterday, finding resistance at 1.0910/30 quite strong. The Marlin oscillator is not resisting this decline, it is approaching the border of the downtrend territory. Crossing this border will accelerate the pair's decline. There are two nearby targets: the MACD line (1.0820) and the target range under it at 1.0789-1.0804.

An alternative scenario will unfold with the price breaking above the resistance range of 1.0910/30, making the next target as 1.0984. On the four-hour chart, the price is falling below the balance and MACD indicator lines. The Marlin oscillator is also in decline territory. We are watching the development of the current downtrend.

Today, the eurozone services PMI for May will be published - a decline from 55.1 to 52.4 is forecasted. In the US, the volume of industrial orders for May will be released, with growth of 0.8% expected.

Analysis are provided by InstaForex

Read More https://ifxpr.com/3JKhihv
 
Forecast for USD/JPY on July 6, 2023

USD/JPY
For the sixth session, the yen has done nothing but move to the right. Such consolidation, however, increases the chances of an upward breakout, first to the target of 145.68, then to 147.40. The price's divergence with the Marlin oscillator is gradually losing strength due to inactivity.

Now, even if the price falls to one of the support levels (143.80, 143.20), there will be a quick reversal. If the Marlin oscillator enters negative territory, which will not happen today, the price may fuel the corrective decline to the embedded line of the price channel around the 142.70 mark.

On the four-hour chart, the price fell under the balance and MACD indicator lines during the sideways movement. The price delay under these lines increases the chances of a decline. The Marlin oscillator is consolidating below the zero line – also a sign of a possible decline in the near future. Under the influence of external circumstances, the price may consolidate above 144.73 and this would point to upward movement.

Analysis are provided by InstaForex

Read More https://ifxpr.com/3pC4VNr
 
The Fed's minutes turned out to be somewhat unexpected

Wednesday was a relatively quiet and calm day for the US currency. In the evening, the FOMC minutes were published, and this document, which usually only contains general information about the meeting, this time might have surprised the markets a bit. A month before the Federal Reserve's June meeting, the market was firmly convinced that the central bank would take a break for 1-2 meetings. After Fed Chair Jerome Powell spoke in the U.S. Congress and openly stated the possibility of two rate hikes in 2023, the chances of a rate hike in June increased. But it didn't increase for long or by much. A week later it dropped back down to 20% and remained there until the very meeting.

Therefore, there was no doubt that the rate decision was made long before the actual meeting, but, as it turned out last night, some FOMC members supported a new increase but simply found themselves in the minority. In my opinion, this is quite unexpected, as Powell in recent weeks instilled confidence in the existence of a unanimous opinion in the monetary committee. However, in any case, the document had a more hawkish stance, which could support the US currency. Since the demand for the greenback did not increase last night, and it sharply fell on Thursday morning, I conclude that the market did not find anything interesting for itself in the minutes, as often happens.

Also take note of the fact that the majority of FOMC members support two more rate hikes this year, which fully coincides with the market's expectations. However, the minutes also state that uncertainty regarding the future of the US economy and inflation is too high, so additional data (future reports) would not be superfluous in determining the rate at subsequent meetings. If inflation continues to decline at a high pace, the rate may only rise once.

The market is left with only two reports this week – Nonfarm Payrolls and Unemployment. A report on wages will be released on Friday, but I think that the market will focus on the first two reports. Thursday's release showed that the labor market is still in excellent condition, but the data from the ADP and Nonfarm Payrolls reports often differ from each other, even though they reflect roughly the same thing. Personally, I believe Friday's release will not disappoint, but various scenarios are possible.

Based on the analysis conducted, I conclude that the downtrend is currently being built. The instrument has enough room to fall. I believe that targets around 1.0500-1.0600 are quite realistic. I advise selling the instrument on "down" signals from the MACD indicator. The wave b is apparently over. According to the alternative layout, the ascending wave will be longer and more complicated, this will be the main scenario in case of a successful attempt to break through the current peak of the wave b.

The wave pattern of the GBP/USD instrument has changed and now it suggests the formation of an upward set of waves. Earlier, I advised buying the instrument in case of a failed attempt to break through the 1.2615 mark, which is equivalent to 127.2% Fibonacci. Wave 3 or c may take a more extended form, or wave e in a wedge will be constructed, and the instrument will return to the 1.2842 mark. Selling looks more promising and I advised it two weeks ago with a Stop Loss above 1.2842, but the signal from 1.2615 temporarily canceled that scenario. We need new signals for short positions.

Analysis are provided by InstaForex

Read More https://ifxpr.com/3rgdspZ
 
Back
Top