Wave Analysis from InstaForex

This week's pack of US data will decide the dollar's fate

This week, the news backdrop will be much stronger than in the previous one. The lion's share of essential reports will come from America, so I will focus on them in this article. Before delving into the data that could significantly affect the dollar's fate, I should note – the labor market and unemployment reports are currently the most crucial because they, along with inflation, influence when the Federal Reserve will stop raising rates and start lowering them. Reports on GDP or business activity are nowhere near as influential as the aforementioned ones.

The first significant report will be released on Tuesday – the JOLTS number of job openings. It's expected that this figure will slightly fall compared to the previous month, but it's rare for the actual value to deviate significantly from market expectations. Hence, while the report is important, the dollar's reaction will depend on the actual figure, which could be neutral.

The second key report is the ADP report on changes in employment in the non-farm sector. This is analogous to the Nonfarm Payrolls but with lesser significance to the market. Reactions to this report are quite frequent, and its values often do not meet market expectations. However, the market values payrolls more, and the final assessment of the labor market's state will be based on the payrolls. Nonetheless, a reaction to the ADP report might also follow.

The third important report is the unemployment rate on Friday. It is expected that for August, the unemployment rate will remain unchanged at 3.5%. However, its increase or decrease can greatly influence market sentiment. I believe that a slight increase will not lead to a decline in the dollar, as this indicator has been near its historical lows for a long time.

The fourth important report is Nonfarm Payrolls, which will be released at the same time as the unemployment report. Payrolls are more significant, and their value has been declining for some time. However, this should not cause confusion, as the FOMC continually tightens its monetary policy, leading to an economic slowdown. Accordingly, the relationship between expectation and reality will be significant here. The forecast is 170,000. Any value above this might cause an increase in demand for the dollar. And the payroll report will most likely overshadow the unemployment report.

Based on the conducted analysis, I came to the conclusion that the upward wave pattern is complete. I still believe that targets in the 1.0500-1.0600 range are quite realistic, and with these targets in mind, I advise selling the instrument. The a-b-c structure appears complete and convincing. Therefore, I advise selling the instrument with targets set around the 1.0788 and 1.0637 marks. I believe that the construction of a downtrend segment will continue, but a corrective wave might start soon.

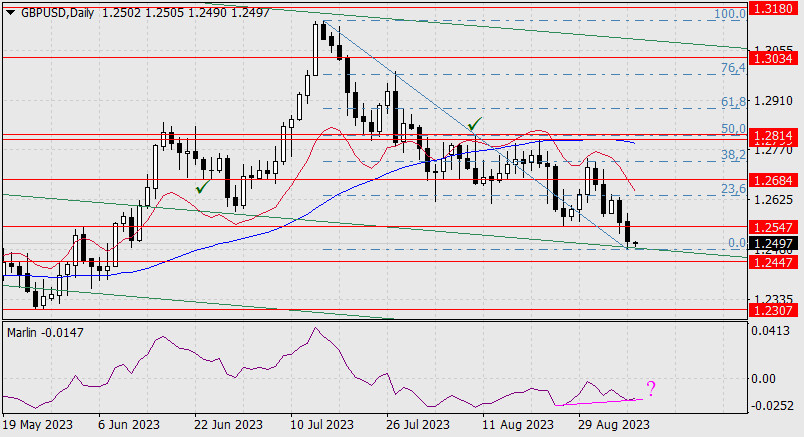
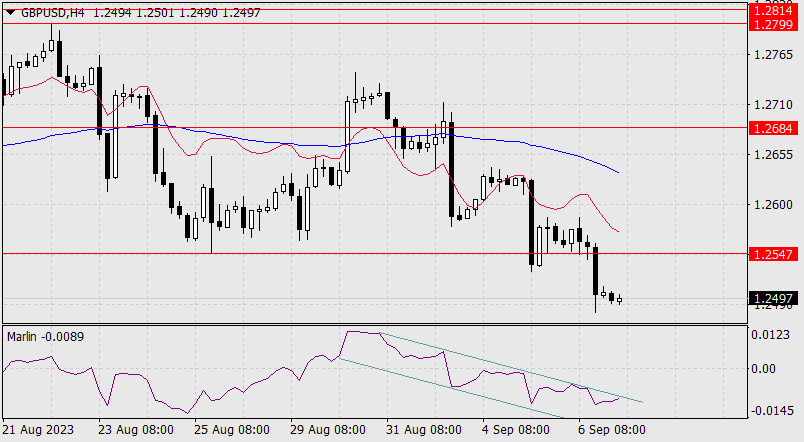
The wave pattern of the GBP/USD pair suggests a decline within the downtrend segment. There is a risk of ending the current downward wave if it is wave "d" and not "1". In that case, wave 5 could start from current levels. However, in my opinion, we are currently witnessing the construction of the first wave as part of a new downward segment of the trend. A successful attempt to break through the 1.2618 mark, corresponding to 127.2% Fibonacci, indicates the market's readiness for new short positions. I advise selling with targets set around the 1.2443 mark.

Analysis are provided by InstaForex

Read More https://ifxpr.com/45rRqzL
 
Forecast for EUR/USD on August 30, 2023

EUR/USD
On Tuesday, the euro tried to approach the support level of 1.0774, but the bulls held on to their strong positions, and as a result, the euro closed the day above the resistance level of 1.0865. The single currency started the day with a bearish correction, but eventually, it will try to test the resistance at 1.0931, above which the MACD line lies. The Marlin oscillator is also approaching the boundary of the uptrend territory. If the price surpasses 1.0931 concurrently with Marlin moving into the growth territory, the euro might receive another support for growth. Potential bullish targets are: 1.1012, 1.1062, 1.1096. This growth has a corrective nature.

In the US, the JOLTS Jobs Openings slowed to 8.82 million in July, well off the estimate of 9.46 million, and June data was revised downwards from 9.582 million to 9.165 million. In Japan, July unemployment increased from 2.5% to 2.7% (the forecast was for it to remain unchanged). Our assumption about the labor market in the US and worldwide losing steam seems justified. We anticipate weak employment data on Friday and the euro to rise further.

On the four-hour chart, the price has settled above the balance and MACD indicator lines, above the 1.0865 level. The Marlin oscillator has sharply jumped. In such a scenario, the price may consolidate and rise further.

Analysis are provided by InstaForex

Read More https://ifxpr.com/44yXFQV
 
USDCHF, H4 | Bounce off support?

The USD/CHF chart exhibits bullish momentum. Potential rebound from 1st support to 1st resistance. 1st support at 0.8772 and 2nd support at 0.8710 (50% Fibonacci Retracement) are crucial. Conversely, 1st resistance at 0.8825 (61.80% Fibonacci Retracement) resists, and 2nd resistance at 0.8866 signifies multi-swing high resistance. These levels indicate potential price reactions.

Analysis are provided by InstaForex

Read More https://ifxpr.com/3EiiPYL
 
Forecast for GBP/USD on September 1, 2023

GBP/USD
As a result of yesterday, the pound fell by 46 points, returning below the 1.2684 level. The signal line of the Marlin oscillator on the daily chart isn't in a hurry to move downwards; on the contrary, it indicates an intent to rise above the zero line.

If the pound realizes this intention, then the pair could rise in the target range of 1.2799-1.2814. Traders across markets are eagerly awaiting today's US employment data for August. If they turn out to be strong, the pound might head towards 1.2547.

On the four-hour chart, the price consolidated below the MACD indicator line, with the Marlin oscillator in a waiting position in the uptrend territory. While waiting for the US data, the price might rise above 1.2684, which would significantly improve the bulls' positions.

Analysis are provided by InstaForex

Read More https://ifxpr.com/3qTYExc
 
Forecast for EUR/USD on September 4, 2023

EUR/USD
The short-term battle of speculators with the release of US employment data ended in favor of the dollar bulls. The dollar index rose by 0.58%, US government bond yields increased (from 4.25% to 4.30% for 5-year bonds), and stock markets closed mixed. The euro lost 66 pips, reaching the target support at 1.0774. Is this a signal or condition for a medium-term decline? At the very least, we need to wait for the price to settle below 1.0774. Next, we need to confirm a confident reversal of the S&P 500. In other words, the initial conditions can only emerge tomorrow. If this doesn't happen, the euro may rise again, attempting to surpass 1.0931 (MACD line).

We currently have a downtrend on the daily chart, so the nearest target is the level of 1.0692. Overcoming this target could result in the pair aiming for the 1.0483-1.0552 range, which includes the descending price channel line and the Fibonacci retracement level.

There is also potential for a bullish scenario, indicated by the emerging convergence between price and the Marlin oscillator.

If the pound realizes this intention, then the pair could rise in the target range of 1.2799-1.2814. Traders across markets are eagerly awaiting today's US employment data for August. If they turn out to be strong, the pound might head towards 1.2547.

On the four-hour chart, the price has paused at the target support of 1.0774. Consolidating below this level will allow the price to reach the target at 1.0692, but the euro can only reach this level if the stock market remains weak.

Analysis are provided by InstaForex

Read More https://ifxpr.com/45CUp8m
 
Forex Analysis & Reviews: Forecast for EUR/USD on September 5, 2023

EUR/USD Yesterday, the euro gained 19 pips despite a relatively muted day. From a technical perspective, the situation has not changed. A close below 1.0774 would pave the way for the bears to reach 1.0692. However, there is a nuance here – it could break the support or a false consolidation to create a distinct convergence with the oscillator rather than leaving it weak as we see it now. On the other hand, it could gradually rise towards the nearest resistance level at 1.0834, then 1.0865, and ultimately 1.0931.

On the 4-hour chart, we have a neutral situation because the price is moving sideways within the 1.0774-1.0834 range. The Marlin oscillator is also moving sideways, and the price is below both indicator lines, and there is no clear direction.

There are no clues on the external side. In the euro area, the composite PMI index for August is expected to fall from 48.6 to 47.0. In the United States, factory orders for July are expected to drop by 2.5%. We await further developments.

Analysis are provided by InstaForex

Read More https://ifxpr.com/47YbgEi
 
Forex Analysis & Reviews: EUR/USD. Why is the dollar appreciating?

The US Dollar Index rose to a near six-month high on Tuesday. Currency pairs of the "major" group changed their configuration accordingly. In particular, the EUR/USD pair plummeted to the 1.0717 level, dropping to its lowest point in nearly three months. Moving forward, traders should be cautious about the current price dynamics. Short positions appear risky despite the swift and sharp decline in price.

Overall, Tuesday's "downward breakout" is solely due to the dollar's strength. At first glance, the greenback has strengthened without any apparent reason, given the nearly empty economic calendar. The primary reason for this has a deeper, more global nature: the dollar is trading higher amid a risk off mood. The US economy is showing signs of resilience, while there are signs that China and Europe are slowing, disappointing investors with declines in key macroeconomic indicators.

The US dollar received support from Chinese fundamental data. Notably, the decline of the Caixin Services PMI reading to 51.8 in August from 51.9 in July, missing market forecasts of an increase to 53.4 points. This is the lowest reading since January. This disappointing result has renewed concerns about the slowdown in the Chinese economy. In response to this report, the Shanghai Composite Index fell by nearly 1%, and the Hang Seng Index dropped by almost 2%.

This report should be considered in conjunction with other reports published in China over the past few weeks. For instance, China's manufacturing PMI rose to 49.7 in August from 49.3 in July. This reading has been below the 50-point mark for the fifth consecutive month. China's non-manufacturing activity index also fell short of the forecast, rising to 51.0 against expectations of 51.3. While it remains "above the waterline," the downtrend has persisted for six months.

At the end of August, The Wall Street Journal published an article on the prospects of China's economic growth. It was quite pessimistic: surveyed economists concluded that the economic model that took China to great-power status seems broken. Weak Chinese fundamental data in July and August (GDP data, trade figures, industrial indicators, PMIs) only illustrated the resounding material from WSJ.

Weak growth in other countries, primarily China and the EU, prompts market participants to acquire the US dollar. Furthermore, according to some experts, the resilient US economy, combined with high inflation (slow decreases in inflation figures), "guarantee" that the Federal Reserve's interest rate will remain high for a long time.

Recent US economic reports indicate that the American economy is feeling fairly confident, despite the extensive and rather aggressive tightening of the Fed's monetary policy. In particular, Goldman Sachs trimmed its prediction for the chance of a recession in the US to 15% from 20%. Therefore, discussions about rate cuts in early next year have essentially been put to rest. Moreover, markets are pricing in another round of rate hikes by the Fed by the end of this year (a 40% probability of a rate hike in November).

At the same time, European reports, for the most part, have been disappointing (PMIs, IFO indices), and representatives of the European Central Bank are expressing concerns about the pace of economic growth in the eurozone. The recently published minutes of the ECB's July meeting also reflected negative trends: ECB members agreed with the chief economist of the ECB that the near-term economic prospects of the eurozone had "deteriorated significantly." Such a news flow has sparked rumors that the central bank may need to start lowering interest rates in the first half of next year. Moreover, the probability of an ECB rate hike in September has decreased to around 30%. Underwhelming China macro data (the EU's largest trading partner) only adds fuel to the fire, simultaneously sparking a risk-off sentiment in the markets.

The dollar, in turn, is benefiting from this situation. On Tuesday, the euro slipped further amid risk-aversion, allowing bears to exit the 8-figure territory and establish a new price range between 1.0710 and 1.0800.

The oil market has also provided more (indirect) support to the greenback, as spike in oil prices reignited fears about US inflation accelerating. Brent crude futures rose above $90 per barrel (the first time since November 18, 2022) on news that Saudi Arabia and Russia are extending voluntary oil production cuts by a combined 1.3 million b/d.

Considering that the EUR/USD pair has approached the lower band of the aforementioned price range (1.0710 - the lower Bollinger Bands line on the daily chart), it's better to be cautious with short positions. In this case, it would be wise to either wait for a bullish correction (to enter short positions aiming for 1.0710) or a breakdown of the support level. In the latter case, the next target for the downward movement will be the 1.0640 level, which is the lower Bollinger Bands line on the weekly chart.

Analysis are provided by InstaForex

Read More https://ifxpr.com/3LaKVJo
 
Forecast for GBP/USD on September 7, 2023

GBP/USD
The pound has reached an important support level from the embedded line of the global descending price channel. The brewing convergence with the Marlin oscillator on the daily chart warns of a price reversal which indicates a deep correction, possibly towards the range of 1.2799-1.2814, i.e. to the MACD indicator line.

analytics64f936cd79ac7.jpg


According to the Fibonacci retracement, such a correction would be 50.0%. If the price reaches the support at 1.2447 and turns around, the Fibonacci levels will also be corrective in nature, marking the lows of August 3 and 14 at 23.6%. Once we confirm that the price has settled below 1.2447, we can then consider 1.2307 as a target.

analytics64f936decb862.jpg


On the 4-hour chart, the price is rhythmically declining below the indicator lines, and the Marlin oscillator is developing in a descending channel but already shows an intention to leave this area by moving upwards. Yesterday's decline was caused by Bank of England Governor Andrew Bailey's speech in Parliament, where he mentioned reaching the peak of interest rates. However, markets still expect the last rate hike in early 2024, and such sentiment won't hinder corrective growth.

Analysis are provided by InstaForex.

Read More
 
XAUUSD H4 | Reacting off 1st Resistance?

The XAU/USD chart currently has a bullish momentum, indicating a potential upward trend. There's a likelihood of continued bullish movement towards the first resistance. The first support at 1913.49 is significant, aligning with the 61.80% Fibonacci Retracement. The second support at 1901.55 is also noteworthy, aligning with the 78.60% Fibonacci Retracement. On the resistance side, the first resistance at 1931.97 aligns with the 38.20% Fibonacci Retracement, and the second resistance at 1943.88 aligns with the 78.60% Fibonacci Retracement.

Analysis are provided by InstaForex

Read More https://ifxpr.com/3LgGNYq
 
Technical Analysis of Intraday Price Movement of Gold Commodity Asset, Monday, September 11 2023

analytics64fe76ff016b7.jpg


With the penetration of the three important levels of the CCI indicator on the 4 hour timeframe, the Gold commodity asset indicates that Sellers are dominating this commodity asset, even though there is currently an upward correction to test the Equal High level of 1928.17, but as long as it does not penetrate above the 1935.42 level, Gold still has the potential to continue. The decline is especially supported by the emergence of the Bearish Continuation Ascending Broadening Wedge pattern, so Gold has the potential to go down and try to penetrate below the 1914.79 level and if this level is successfully penetrated, the level of the Daily Bullish Fair Value Gap area in the range of 1903.38-1911.29 will be the next target to be aimed at.

Analysis are provided by InstaForex.

Read More
 
NZDUSD H4 | Falling to 1st support?

The NZD/USD chart currently shows a bullish trend with potential for further upward movement. The 1st resistance at 0.5930, coinciding with the 50.00% Fibonacci retracement, is a key level that may impede bullish progress. Similarly, the 2nd resistance at 0.5992 is also significant for potential resistance.

On the downside, the 1st support at 0.5891 aligns with the 61.80% Fibonacci retracement and serves as a strong support level. The 2nd support at 0.5862, identified as a pullback support, adds to the support zone.

Analysis are provided by InstaForex

Read More https://ifxpr.com/3LhemcE
 
Forex Analysis & Reviews: Forecast for EUR/USD on September 13, 2023

EUR/USD:
Yesterday, the volatile day ended in favor of the bulls. Despite the numerous target levels on the daily chart, which is due to the corrective nature of the growth, the main target is defined by the MACD line around 1.0913. Overcoming the nearest resistance at 1.0777 will open the second target at 1.0803, the low from August 23rd.

Today, the main driving force could be the US inflation data for August. The forecast for the core CPI is 4.3% YoY, compared to 4.7% YoY the previous month, and the forecast for the CPI suggests an increase from 3.2% YoY to 3.6% YoY. If we assume that the data will come out in line with economists' calculations, investors will pay more attention to the decrease in the core CPI, as the Federal Reserve relies more on it. As a result, expectations of a rate hike will decrease, and the euro will rise.

Analysis are provided by InstaForex

Read More https://ifxpr.com/3sUIyUP
 
Last edited:
Forex Analysis & Reviews: Forecast for EUR/USD on September 14, 2023

EUR/USD
Yesterday's US CPI data came in around forecast levels. The August Core CPI dropped from 4.7% YoY to 4.3% YoY, while the CPI rose from 3.2% YoY to 3.7% YoY (forecast 3.6% YoY). Considering that industrial production in the eurozone plummeted by 1.1% in July and decreased by 2.2% YoY (forecast -0.3%), the euro's decline could have been greater than the 24 pips that we saw yesterday.

Trading volumes were substantial, indicating that there was market activity, and traders preferred to hold their positions ahead of today's European Central Bank meeting, as the probability of a rate hike stands at 68%. If investors showed an intention not to sell the euro based on US inflation data, they may buy it following the ECB meeting. The bullish target is the 1.0824/32 range. Technical convergence in action. A price above this range will open up the target of 1.0882. The MACD line is approaching this level.

On the 4-hour chart, the price is between the balance and MACD indicator lines. The Marlin oscillator is currently holding an uptrend. A waiting mode is likely until the ECB announces its rate decision.

Analysis are provided by InstaForex

Read More https://ifxpr.com/45RGA63
 
GBPUSD H4 | Bearish Continuation Expected?

The GBP/USD chart currently shows a bearish momentum due to trading below the bearish Ichimoku cloud. This could lead to a continued bearish movement towards the significant 1st support level at 1.2372, which is marked as an overlap support. Additionally, the 2nd support at 1.2309 is recognized as a swing low support.

On the resistance side, the 1st resistance level at 1.2448 is a pullback resistance, possibly hindering upward movement. The 2nd resistance at 1.2533 is an overlap resistance, suggesting its potential as a point of reversal or resistance.

Analysis are provided by InstaForex

Read More https://ifxpr.com/3EK4zbm
 
GBPUSD Day | Bearish Continuation Expected?

The GBP/USD chart displays a dominant bearish trend, emphasized by its position below the bearish Ichimoku cloud and a descending trend line. Key supports stand at 1.2293, backed by the 78.60% Fibonacci Projection, and 1.2182, aligned with the 100% Fibonacci Projection. Resistances are identified at 1.2418 and 1.2632, with the latter being an overlap resistance. The overall outlook remains bearish.

Analysis are provided by InstaForex

Read More https://ifxpr.com/3PHlotS
 
Are you starting up your trading career? If so then make the very first step right, and that of selecting a reliable, trustworthy and genuine broker. It is where FXOpulence comes in. The name associated with finest quality, regulated by ASIC, with rapid deposit/withdrawals, and countless favorable trading conditions.

You can begin with as low as 100 USD, yet have finest conditions to trade with, so be part of the future, be part of FXOpulence, where you come FIRST!

Further Details At: https://www.fxopulence.com/

#FXOpulence #Forextrading #digitaltrading #ASICregulated
 
Forecast for GBP/USD on September 19, 2023

The British pound closed Monday at the same level as Friday's closing level. The Marlin oscillator rose, reinforcing the double convergence with the price. We can see that the signal line of the oscillator is converging into a wedge, and an upward exit (most likely) from it will fuel the price growth.

The nearest bullish target is 1.2547, followed by 1.2617. The third target is 1.2684. The MACD indicator line is approaching this level.

On the 4-hour chart, we see a build up in the convergence. A break above 1.2444 will also correspond to Marlin's move into the bullish territory. Such a pattern will support the pound. We await the results of tomorrow's Federal Reserve meeting.

Analysis are provided by InstaForex

Read More https://ifxpr.com/3ZuRtbJ
 
Back
Top