Wave Analysis from InstaForex

Forecast for AUD/USD on May 18, 2023

AUD/USD The Australian dollar traded within the target levels of 0.6628 and 0.6670 yesterday. The reversal of the Marlin oscillator's signal line from the zero line was confirmed (arrow) on the daily chart.

Now, the probability of the price overcoming the 0.6628 support has significantly increased, and the price will soon reach the target level of 0.6567 (the low of March 8). In case of an alternative scenario, with the price surpassing 0.6670, it will continue to rise to the MACD line around the 0.6704 mark.

On the four-hour chart, the Marlin oscillator's signal line has turned down from the oscillator's zero line. The price is developing under the balance and MACD indicator lines. In the short term, we expect the price to overcome the 0.6628 support level according to the main scenario.

Analysis are provided by InstaForex

Read More https://ifxpr.com/41I90N2
 
Forecast for EUR/USD on May 19, 2023

EUR/USD
The euro did not develop a sideways movement, so as not to delay the breakthrough under the technical support level of 1.0804. Trading volumes were average, which means that the systematic buying of the dollar is underway, and the nearest big accumulation of orders is in the range of 0.0680-0.0730. Near this area is our target level of 1.0736. Consolidating below it will pave the way for 1.0636 - the underlying embedded line of the price channel, coinciding with the March 2020 low.

At the moment, a potential for a correction has emerged again, its goal is the level of 1.0804. There is one reason why the euro could fall without going through a correction - increased optimism regarding the resolution of the problem with the US public debt. There is a probability that the dispute in the US government on this issue will end this weekend.

A renewed convergence was formed on the four-hour chart. Since yesterday's low coincided with the point of intersection of price channel lines of two time scales (on 4H linear regression channel), the probability of a correction has increased. This probability may significantly go down once the price settles below yesterday's low.

Analysis are provided by InstaForex

Read More https://ifxpr.com/3IkZicQ
 
EUR/USD. Week Preview. Buckle up, price turbulence expected

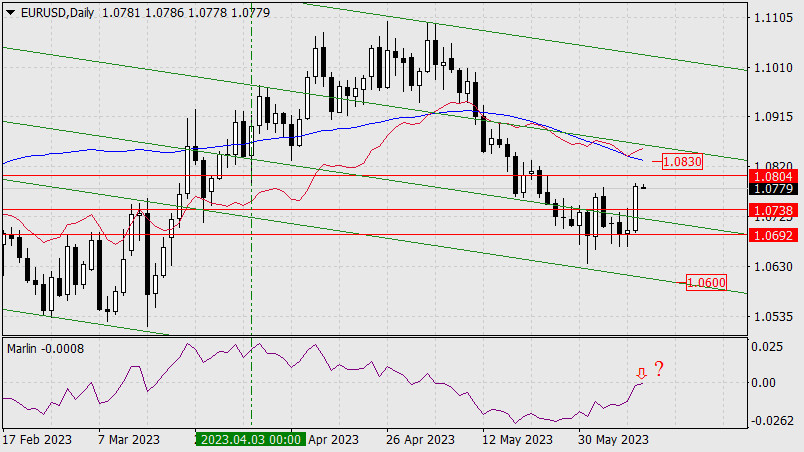
The EUR/USD pair failed to consolidate within the 7th figure by the end of the past week: at the end of Friday's trading, EUR/USD bulls organized a small but swift counter-attack, which led the price to rise to the level of 1.0804. The corrective pullback was due to a weakening of the US currency, which came under pressure against the backdrop of Jerome Powell's cautious rhetoric.

The Chairman of the Federal Reserve suggested that the May rate hike could be the last in the current monetary policy tightening cycle. This unexpected plot twist unpleasantly surprised dollar bulls, after which the greenback fell across the market. Under other circumstances, this fundamental factor would have had a strong impact on the dollar for a quite long time. But under current conditions, Powell's "dovish" comments may take a back seat. The focus is on the political confrontation between Republicans and Democrats, whose inability to reach an agreement could lead to a default on the US national debt.

There is no doubt that this topic will be the "number 1 issue" for all dollar pairs. All other fundamental factors will take a back seat - including Powell.

Biden raises the stakes
Exactly one week ago - May 14 - the President of the United States announced that negotiations with Congress on raising the debt ceiling are "progressing," and more about their progress will be known literally "in the next two days". At the same time, he emphasized that he is optimistic about the prospects of reaching a compromise. In anticipation of the next round of negotiations, assistants to the President of the United States and the Speaker of the lower house of Congress, Kevin McCarthy, began to form a "road map" to curb federal spending in order to resume negotiations on raising the debt ceiling.

The negotiations indeed took place - but ended in failure. The parties just "agreed to agree", but no more. Now the situation is up in the air. Another round of negotiations should take place after Biden completes his visit to Japan, where the G7 summit is being held. At the same time, the head of the White House canceled his planned visit to Australia, which speaks to the seriousness of the situation.

Important point: if the US President previously assessed the prospects of the negotiation process optimistically, today he has changed the tone of his rhetoric. For example, today he stated that declaring a default is "personally out of the question for him", but at the same time, he cannot guarantee that Republicans will not push the country into default by "doing something outrageous" (originally by Reuters agency - "Biden said he still believed he could reach a deal with Republicans, but could not guarantee that Republicans would not force a default by 'doing something outrageous'").

In this context, Biden called on Congress to work on the issue of raising the debt ceiling. He also emphasized that he would not agree to a bipartisan debt ceiling deal "exclusively on the terms of the Republicans". The head of the White House expressed readiness to cut spending, but stated that he does not intend to fulfill all the demands of Republican congressmen.

The terrifying word "default"

Judging by the escalation of the situation, a default no longer seems unthinkable. One can assume that Biden has decided to raise the stakes with his rhetoric before decisive negotiations, shifting the responsibility for possible default consequences onto the Republican party. However, in the context of currency traders' reaction, it doesn't really matter - whether it's a bluff or a real threat. Such statements from the President of the United States are capable of significantly shaking the markets. Considering that the aforementioned comments were made on a non-working day, dollar pair traders should prepare for a significant gap (in the case of the EUR/USD pair - a downward gap).

Overall, the upcoming week is packed with events. For example, on Monday, three representatives of the Federal Reserve (Bullard, Barkin, Bostic) will speak; on Tuesday, PMI indices will be published in Europe, and data on the volume of new home sales will be released in the US; on Wednesday, the minutes of the May meeting of the Federal Reserve are expected to be published along with a speech by ECB President Christine Lagarde; on Thursday, data on the volume of pending home sales will be disclosed in the States; and finally, on Friday, the most important inflation indicator - the core personal consumption expenditures index - will be published in the US.

But all these reports, as well as the speeches of representatives of the Federal Reserve and ECB, will remain in the shadow of the key topic of the upcoming week. The fate of the US national debt is the number 1 issue for dollar pair traders, so all eyes will be on the corresponding negotiations of American politicians. Especially since there is not much time left until the "hour X": as the US Treasury previously warned, on June 1, the country's government may declare a debt default if Congress cannot raise the debt ceiling.

Conclusions
Under such fundamental circumstances, it is extremely difficult to predict the possible trajectory of EUR/USD. It can only be assumed that at the start of the new trading week, risk-off sentiments in the markets will rise again, and this fact will provide significant support to the dollar. In this case, the pair will return to the area of the 7th figure with a target at 1.0700. But everything will depend on the negotiation capabilities of Republicans and Democrats. If they do find common ground and announce an increase in the debt ceiling, the spring will unwind in the opposite direction - against the American currency (especially in light of Jerome Powell's recent statements). If the negotiation saga drags on until next weekend, the dollar will continue to gain momentum, acting as a beneficiary of panic sentiments.

Considering the previous statements of Republicans, Democrats, and Biden himself, the negotiations will be very challenging - therefore, dollar pairs may once again find themselves in the area of price turbulence.

Analysis are provided by InstaForex

Read More https://ifxpr.com/3MocOh2
 
Forecast for EUR/USD on May 23, 2023

EUR/USD
Yesterday, the US stock market closed mixed, bond yields slightly increased, and as a result, the euro did not extend the corrective growth that started on Friday.

Nevertheless, the day closed with a white candlestick above the level of 1.0804, and the signal line of the Marlin oscillator continues to rise, suggesting that we might see a bullish correction. For this to happen, the price needs to surpass the previous day's high at 1.0832. The upper limit of the corrective growth is represented by the embedded line of the price channel around the 1.0887 mark. If the price consolidates below 1.0804, it will indicate that the previous breakout above the level was false and will pave the way to the target at 1.0736.

On the four-hour chart, the price is consolidating above the level of 1.0804. The subsequent price movement is more likely to be upward, but not significantly, towards the nearest resistance at 1.0845 - the MACD line. The Marlin oscillator is moving parallel to the zero line in the positive area. The balance indicator line (red) is holding back the growth, but even with moderate price growth, it will adapt and stay above the price. This indicates the corrective nature of the potential growth.

Analysis are provided by InstaForex

Read More https://ifxpr.com/3omG9jV
 
Forex Analysis & Reviews: Forecast for EUR/USD on May 24, 2023

EUR/USD:
The euro is falling for significant reasons - the imminent increase in the debt limit (which will lead to a massive influx of dollars from outside to purchase US government bonds) and a more hawkish stance from the Federal Reserve regarding interest rates than what the markets currently expect (yesterday, Neel Kashkari and James Bullard mentioned raising rates above 6% as inflation persists).

However, from a technical standpoint, the situation is ripe for a correction. On the daily chart, a small weak convergence between price and the Marlin oscillator is forming. The price has not reached the embedded line of the price channel (green line), creating a dual situation: either the inclined support will be tested today, or the price will go up to 1.0804 and only after that will it attack 1.0736, surpassing the price channel line. A drop below 1.0736 opens the target at 1.0625, the lower embedded line of the price channel.

On the 4-hour chart, the price is falling below both indicator lines, and the Marlin oscillator is declining in bearish territory. The resistance level at 1.0804 is reinforced by the MACD indicator line here. Yesterday's trading volumes were at average May levels, which does not provide a basis for an immediate breakthrough of support. Perhaps a small correction will allow investors to accumulate short positions.

Analysis are provided by InstaForex

Read More https://ifxpr.com/3Oy3v0D
 
Forecast for EUR/USD on May 25, 2023

EUR/USD:
Yesterday, the EUR/USD pair tested the resistance level of 1.0804 and closed the day on the lower embedded line of the price channel. The convergence between the price and the Marlin oscillator continues to influence the pair on the daily chart, and the pair could enter a correction from the support level of 1.0736 (the high of December 15, 2022).

If the price consolidates below the aforementioned level, the convergence will cease to exist, and the price will continue to move towards the next price channel line around 1.0625. The intermediate support is at the level of 1.0692, the high of March 1.

On the 4-hour chart, the price is falling below both indicator lines. The Marlin oscillator has a small probability of forming a double convergence (exactly when the price tests the level of 1.0736), after which the price may undergo a corrective rise towards the MACD line, which is slightly below the resistance level of 1.0804. In addition, Marlin may easily break its own generating line and continue to fall along with the price.

Analysis are provided by InstaForex

Read More https://ifxpr.com/433CsP9
 
Forecast for GBP/USD on May 26, 2023

GBP/USD:
Yesterday, the pound opened and closed below the MACD indicator line. The downward movement may move towards the target range of 1.2125/53.

The Marlin oscillator has slowed down and shows an intention to move up, which may indicate preparation for a correction to the MACD line (1.2400). If the correction does not occur and the support at 1.2273 is breached, we expect the price to reach the specified target range.

On the four-hour chart, the Marlin oscillator has a good potential for a decline. The price is below the balance and MACD indicator lines. If a correction does occur (while awaiting agreements on the U.S. debt limit), the upper limit of the correction is also the MACD indicator line at 1.2400.

Analysis are provided by InstaForex

Read More https://ifxpr.com/434OMyw
 
Forex Analysis & Reviews: Forecast for EUR/USD on May 29, 2023

EUR/USD:
Last Friday, the euro traded within a range of 56 pips, closing the day at the opening level. The resistance of the target level at 1.0736 and the embedded line of the price channel were tested. Today, the price is not willing to repeat what it did on Friday, but the small convergence with the Marlin oscillator indicates that the price doesn't intend to enter a correction. Today is a holiday in the US and the UK, so we do not expect any significant or qualitative changes in the technical picture.

The threat of a US default (or a budget shutdown) has also passed, as the White House and Republicans have reached an agreement on a 2-year debt limit. The agreement will be passed by the lower chamber tomorrow. If the price consolidates above 1.0736, it may develop a corrective rise towards 1.0804, while falling below 1.0692 would allow the price to target the bearish level of 1.0628.

On the four-hour chart, the price failed to consolidate above 1.0736 on Friday, and this morning it has already settled below it, supported by the downward-turning Marlin oscillator. The price is trying to either stay above 1.0692 or remain in a sideways movement. The first strong resistance for the corrective movement is represented by the MACD line at 1.0756.

Analysis are provided by InstaForex

Read More https://ifxpr.com/43eNMIq
 
Forex Analysis & Reviews: Forecast for EUR/USD on May 30, 2023

EUR/USD: Yesterday, when the US and UK had a holiday, the euro cautiously tested the resistance of the nearest descending price channel line and ended the day lower. It appears that the bears are struggling to maintain pressure on the quotes. According to our main scenario, when the US government makes the final decision to raise the debt ceiling (tomorrow, as the lower house of Congress approves it today), the dollar will advance against all global currencies. However, this scenario has a visible pitfall - the desire of major players to eliminate premature dollar bulls. In this case, the euro may rise to the target level of 1.0804.

On the other hand, if investors expect long-term strengthening of the dollar, initiating a move with a preliminary upward price spike of just one figure may not be a very effective endeavor. Historically, false movements of the euro against news of debt limit increases have occurred intermittently. It is difficult to predict how things will unfold today. Even from a technical perspective, the small convergence on the daily chart indicates both a potential minor correction and its possible breakdown due to strong news.

On the four-hour chart, the price is getting closer to the MACD indicator line, from which a downward reversal may occur, or with the assistance of the Marlin oscillator, which is ready to enter the positive territory, the price could climb to the target level of 1.0804 (February 14 and May 24 highs). The MAcD line (1.0738) coincides with the price channel line on the daily chart, making it a strong level. There is a certain probability that the euro will decline without a preliminary corrective rally.

Analysis are provided by InstaForex

Read More https://ifxpr.com/3qjbqor
 
Forecast for EUR/USD on May 31, 2023

EUR/USD
On Tuesday, the euro went through a correction, defined by the convergence with the Marlin oscillator. The price once again tested the target level of 1.0738 and the embedded line of the descending channel. The signal line of the oscillator has entered its own descending channel.

According to the main scenario, the price can now consolidate below the support level of 1.0692 and continue moving towards 1.0620, which is the lower embedded line of the price channel. The alternative scenario is simple - after settling above 1.0738, a test of the target resistance at 1.0804 is possible. This would extend the correction.

On the four-hour chart, the price has returned below the MACD indicator line after a false breakout above it. The Marlin oscillator has moved into the negative territory after briefly staying in the positive area. The trend is bearish

Analysis are provided by InstaForex

Read More https://ifxpr.com/3IPShAN
 
Forecast for EUR/USD on June 1, 2023

EUR/USD:
The euro closed yesterday with a black candle. The lower shadow almost reached the target line of the descending price channel. Surprisingly, such a strong movement from the technical side did not improve the bears' position. A convergence between the price and the Marlin oscillator has only intensified, and the oscillator's signal line has not reversed from the upper limit of its own channel. In addition, the price did not consolidate below the target level of 1.0692.

As a result, we return to yesterday's state: a breakout above 1.0738 opens the target of 1.0804, while a consolidation below 1.0692 allows the price to once again attack 1.0620. Breaking through this level opens the path to 1.0497.

On the 4-hour chart, the price is still below the balance and MACD indicator lines, and the Marlin oscillator is in negative territory. Therefore, the bears have a chance to prevail.

Analysis are provided by InstaForex

Read More https://ifxpr.com/45RSvS2
 
Technical analysis of GBP/USD for June 01, 2023

Overview :
The GBP/USD pair faced resistance at the level of 1.2545, while minor resistance is seen at 1.2545. Support levels found at the levels of 1.2493 and 1.2454.

Yesterday, the GBP/USD pair continued to move upwards from the levels of 1.2493 and 1.2454. The pair rose from the levels of 1.2493 or 1.2454 to the top around 1.2523.

In consequence, the GBP/USD pair broke resistance, which turned strong support at the level of 1.2545.

Moreover, the RSI starts signaling an upward trend, and the trend is still showing strength above the moving average (100). Hence, the market is indicating a bullish opportunity above the area of 1.2493 - 1.2454. So, the market is likely to show signs of a bullish trend around 1.2493 and 1.2454.

Today, the level of 1.2493 is expected to act as major support. Hence, we expect the GBP/USD pair to continue moving in the bullish trend from the support level of 1.2493 towards the target level of 1.2545.

If the pair succeeds in passing through the level of 1.2545, the market will indicate the bullish opportunity above the level of 1.2545 in order to reach the second target at 1.0002 to test the double top in the H1 time frame.

However, the price spot of 1.2593 remains a significant resistance zone. Thus, the trend will probably be rebounded again from the double top as long as the level of 1.2454 is not breached.

Analysis are provided by InstaForex

Read More https://ifxpr.com/43BlzeC
 
Forecast for GBP/USD on June 5, 2023

GBP/USD: On Friday, the pound fell by 75 pips amid mixed but not exactly weak US employment data. This morning, upon the news of President Biden signing a bill to lift the debt ceiling on Saturday, the pound lost another 20 pips, entering the range of the May 31 candle.

The nearest target at 1.2403, the MACD daily line, is now open. Breaking below this line opens up the target of 1.2273, which is both the April 3 low and the February 14 high. The Marlin oscillator is moving deeper into the downtrend area, and it may reach the oversold zone when the price approaches the target range of 1.2125/53.

On the four-hour chart, the price is moving between two target levels while the Marlin oscillator remains negative. It is likely that the price will attempt to break 1.2403. If successful, the pound will aim for the MACD line on the four-hour chart around 1.2370. Breaking below this support, the British pound will be aiming for 1.2273.

Analysis are provided by InstaForex

Read More https://ifxpr.com/45KPxhU
 
Technical Analysis of GBP/USD for June 6, 2023

Technical Market Outlook:
The GBP/USD pair had reversed sharply lower after the technical resistance level seen at 1.2550 was too strong to be broken. The bears moved below all of the MA levels, but eventually the market bounced from the short-term trend line support seen at the level of 1.2367. The momentum reversed sharply from the extremely overbought conditions on the H4 time frame as well and is currently moving testing the level of fifty. There is still a room for a momentum and price to move lower, so the short-term outlook remains bearish.

Weekly Pivot Points:
WR3 - 1.25080
WR2 - 1.24565
WR1 - 1.24223
Weekly Pivot - 1.24050
WS1 - 1.23708
WS2 - 1.23535
WS3 - 1.23020

Trading Outlook:
A Bearish Engulfing candlestick pattern on the Weekly time frame chart 100 pips away from the 61% Fibonacci retracement located at the level of 1.2778 might indicate the corrective cycle to the upside had been terminated. Any sustained breakout below the technical support at 1.2444 will be the first indication of stronger bearish pressure.

Analysis are provided by InstaForex

Read More https://ifxpr.com/3WRkywI
 
Technical Analysis of Intraday Price Movement of Silver Commodity Asset, Wednesday, June 07 2023

analytics647ff6a5b38ec.jpg


With the appearance of Deviation between price movement of Silver commodity asset with osMA indicator on its 4 hour chart, then it can be confirmed that if in the neareast future Silver will go down up to the level 23,204, and if this level successfully broken below, then Silver has the opportunity to continue its downside up to the level 22,875. But, if there is a quite significant upward correction, especially if it go up to the level 23,920, then the downward scenario which has been described below will become invalid and will cancel itself.

Analysis are provided by InstaForex.

Read More
 
USDCHF, H4 | Break above the resistance?

analytics64815dcbb17b3.jpg


The USD/CHF chart exhibits bullish momentum as the price remains above a significant ascending trend line, suggesting further potential for upward movement.

There is a possibility of continued bullishness towards the first resistance level at 0.9117, identified as an overlap resistance.

Support levels at 0.9023 and 0.8954, the latter coinciding with the 61.80% Fibonacci retracement, serve as significant levels of potential support.

An intermediate resistance level at 0.9091 is recognized as a multi-swing high resistance, highlighting its importance.

Analysis are provided by InstaForex.

Read More
 
Forecast for EUR/USD on June 9, 2023

EUR/USD
Yesterday, the euro surged upward by 83 pips, coming close to the target level of 1.0804. Now the situation is threefold: since the level of 1.0804 is based on the peak of February 14 (and the trough of January 31), the euro may still move a few pips to test this strong level. However, if the market is more keenly aware of the trough on April 3, it has already reached this level and the price may reverse downward right now. The corrective movement will end, and the pair will start to fall towards the 1.0600 target. If the 1.0804 level weakens over time, the corrective movement may continue until the price reaches the MACD indicator line (1.0830).

analytics64829011cd53d.jpg


Yesterday, the Reserve Bank of India maintained the benchmark rate at 6.50% as expected, which left market participants confused, boosted by an increase in initial jobless claims (261,000 versus 233,000 the previous week) - fear of a possible pause in the Federal Reserve's tightening cycle resurfaced. Additional turmoil came with the announcement that the eurozone officially entered a recession with the release of GDP data for the first quarter (-0.1%) and the revision of fourth-quarter GDP from 0.1% to -0.1%.

analytics64829023ca689.jpg


Such news doesn't actually help the euro to strengthen. Moreover, on Tuesday, a day before the Fed's rate decision, US CPI data will be released, which may further agitate investors. Therefore, it is risky to buy the euro right now. On the four-hour chart, the price is rising above both indicator lines, but the Marlin oscillator seems to have finished rising. Therefore, it is still possible to test the target level of 1.0804, but further growth would appear illogical and purely speculative.

Analysis are provided by InstaForex.

Read More
 
Back
Top