Wave Analysis from InstaForex

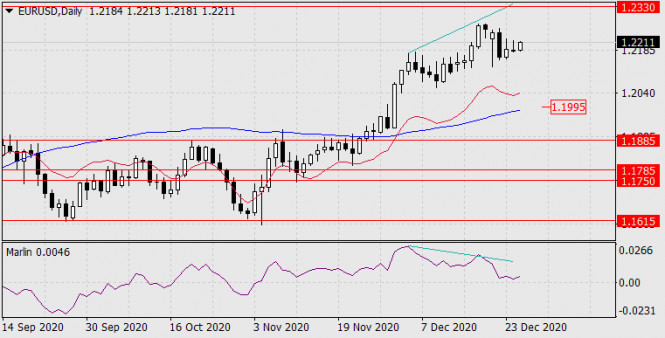
EURUSD. Central European Bank has designated the level of resistance

Yesterday's reaction to the bank level of 1.1883 indicates that growth is being held by placing large limit orders. There is a high probability of a decline to the support zone formed from the level of 1.1769. This model is a priority at the end of this week and the beginning of next week.

This model will continue to form a medium-term accumulation zone. It is important to understand that sales must be recorded when testing the lower banking zone. This will help in avoiding missed opportunities.

If the test of the 1.1769 level leads to a large demand, then you will need to open purchases. The growth target will be a return to the level of 1.1883. This model is valid until next Wednesday which makes purchases profitable after a decline to 1.1769. Don't forget to fix your positions when you reach the support and resistance zones.

Analysis are provided by InstaForex
 
Forecast for EUR/USD on November 20, 2020

EUR/USD
Yesterday, the euro showed increased dynamics on average trading volumes, the range was 68 points. The support was provided by the balance and MACD indicator lines on the four-hour chart. The Marlin oscillator did not manage to gain a foothold in the bears' territory and went back to the growth area. We have a rising trend on the four-hour chart. The nearest target 1.1903 is the MACD line on the daily chart.

The daily chart shows that the situation also tends to rise, but the resistance of the MACD line looks strong, the price has pulled back from it twice in the last three days.

If the euro gathers strength, it is possible to overcome the 1.1903 level and even reach the border of the price channel at 1.1938, but further growth is possible only with strong fundamental factors. In this case, the target is the 1.2010/40 range.

In general, the euro confirmed that it is not going to leave the wide free roaming zone of 1.1750-1.1930. We are waiting for the development of events.

Analysis are provided by InstaForex
 
Forecast for EUR/USD on November 23, 2020

EUR/USD
The euro settled below the MACD indicator line on the daily chart for the last two days. A pronounced consolidation provides more prerequisites for overcoming the resistance of the MACD line (1.1902), which will help the euro reach the upper border of the downward price channel on a weekly scale (1.1936) and even to its breakout with the subsequent target at 1.2010. And from a fundamental point of view, this scenario is reinforced by the next postponement of the Brexit deadline to December 10, which is when the Brexit deal is expected to be adopted at the EU summit. The agreement itself may be ready by November 30th.


The Marlin oscillator does not provide hints on the daily scale, it moves horizontally.
The four-hour chart shows that Marlin is turning upward from the border of the bears' territory, the price is developing above the balance and MACD lines, which ultimately increases the likelihood of rising further to about 60%.

The growing market sentiment may be shaken when the price settles below the MACD line at the four-hour chart, below 1.1840 to be more specific. The 1.1750 target level will become relevant again. We are waiting for the development of events.

Analysis are provided by InstaForex
 
Forecast for AUD/USD on November 24, 2020

AUD/USD
The Australian dollar lost 15 points under the overall optimistic pressure of the US dollar on Monday. But while the Australian currency is in no hurry to leave the range of the last six trading sessions, it needs to make sure that the market intends to further strengthen the US currency. During this waiting time, even if it does not work out the upper target of 0.7380, AUD/USD can form a double divergence with the Marlin oscillator. The most important economic data for Australia will only be available next week, such as Quarter 3 GDP, trade balance, PMI, and construction. Since the RBA meeting will take place on Tuesday, December 1, the "kangaroo" can feel quite free until the end of the week.

On the four-hour chart, the price consolidated under the MACD indicator line, the Marlin oscillator briefly went into the negative zone, and this morning it is trying to get back into the growth zone. Neutrality is also observed here on the four-hour scale. It still waits for the price to fall below the level of 0.7260, which is under the daily MACD line.

Analysis are provided by InstaForex
 
AUD/USD Forecast for November 25, 2020

AUD / USD
The Australian Dollar successfully took advantage of yesterday's weakness of the US Dollar. On the weakening of the dollar index by 0.40%, 75 points (1.02%) were added to the Australian currency. The price reached the target level of 0.7380 this morning and at the same time formed a triple divergence (on the bodies of candles) with the Marlin oscillator.

With the greatest probability, the price can now turn down with an attack on the support of the Kruzenshtern line (0.7255), which coincides with the level of the lows on November 19 and 10 (and also on September 4).

On the four-hour chart, the price is above the balance line and the Kruzenshtern line. The Marlin oscillator held yesterday's price growth in the sideways direction which may be an early sign of a reversal or correction. Fixing the price under the Kruzenshtern line (0.7342) will be the first sign of a reversal, after which it is advisable to wait for confirmation of this signal and opening short positions. Confirmation may be the departure of Marlin in the negative area, this will be approximately when the price reaches the level of 0.7330.

Analysis are provided by InstaForex
 
Last edited:
Forex Analysis & Reviews: AUD/USD Forecast for November 26, 2020

AUD/USD
The Australian Dollar was ready yesterday to turn from the target resistance 0.7380, a decline of 50 points, but the European currencies showed the optimism of American investors out of the market before today's holiday. As a result the Aussie closed the day up 5 points. The potential for divergence formation on the daily chart remains. The level of 0.7380 has not been overcome but the probability of this has increased. The target in this case is the 0.7440 level.

On the four-hour chart, the price punctured the Kruzenshtern line twice yesterday but this was in a growing trend, as the price remained above the balance indicator line. The signal line of the Marlin oscillator has created a wedge-shaped structure, from which an upward exit is expected.

So, with a probability of 80%, the price is likely to go above the level of 0.7380 and further increase to 0.7440.

Analysis are provided by InstaForex
 
Forex Analysis & Reviews: Forecast for EUR/USD on November 27, 2020

EUR/USD
In the absence of American investors in the market, the euro did not dare to overcome the important resistance of the upper line of the price channel on the daily chart on Thursday. Confusion made it possible for a divergence reversal to form with the Marlin oscillator. European stock indexes also showed no desire to rise yesterday, the main ones closed the day with a slight decline. Obviously, the markets will not grow today either, as any negotiations between the UK and the EU on Brexit may end on Monday.

At the moment, the daily price is between the MACD line and the price channel line. The price can't go up, but now it can slightly go down on closing long positions. Direct short deals on the euro may begin next week.

The four-hour chart shows that the price is still receiving support from the MACD line, but the signal line of the Marlin oscillator did not rise from its own range (gray rectangle), as we expected yesterday, but now this line can go down from the range. A signal to open short positions is when the price falls below yesterday's low of 1.1885.

Analysis are provided by InstaForex
 
Forex Analysis & Reviews: Gold price breaks $1,800

Gold is trading below $1,800 and today it made a new lower low at $1,773. In our latest Gold analysis when price was trading near $1,810-20 resistance area by the bearish channel, we noted the bearish flag pattern and that we expect Gold price to move to new lows towards $1,770-50. The upper side of the target range has been reached today.

Blue lines - bearish channel
Gold price is moving lower in a textbook style as price gets rejected at the upper channel boundary resistance and breaks lower towards $1,770. Trend is clearly bearish and no sign of reversal yet. Gold price will most probably continue lower. A bounce towards $1,800 is not out of the question but it would not be something we would bet on.

Analysis are provided by InstaForex
 
Forex Analysis & Reviews: Forecast for EUR/USD on December 1, 2020

EUR/USD
According to news agencies, stock market participants took profits yesterday, due to which the S&P 500 fell by 0.46%, and the Dow Jones -0.91%. Trading volumes were large, a sign of flight from the stock market before the announcement of the UK's exit from the EU without a deal. The euro lost 35 points on the same expectations, falling from the day's high with 77 points. The price slightly fell short of the target level 1.2010/40. Divergence on the daily chart is gaining strength

Taking the high volumes of yesterday's trading into account, which were the highest for the euro over the past two weeks, investors are unlikely to want to try to take it a second time. Now we are waiting for the price to move under the MACD line (1.1896) and the attack on support at 1.1750. If successful, it will be followed by - reaching the lower embedded line of the price channel in the 1.1620 area.

The four-hour chart shows that the signal line of the Marlin oscillator has returned to the lower border of its own range. At the same time, the price reached the support of the MACD indicator line. Since the price overcame yesterday's low of 1.1926, it is possible to open short deals while aiming for 1.1750 and 1.1620.

Analysis are provided by InstaForex
 
Forex Analysis & Reviews: Gold to end the week near intra weekly highs.

Gold price made another attempt towards $1,850 today but price got rejected once again. Bulls should get worried if after a rejection price moves away too far from $1,850. Bulls should be worried if after the rejection price breaks below short-term support of $1,820.

Blue rectangle - resistance area
Black lines -Fibonacci retracements

Gold price is trading near but below the key resistance of $1,850-60. This area was once key support and is now key resistance. I do not expect Gold to break this level, at least not now. I believe we will first see a pull back at least towards the 38% Fibonacci level if not towards the 61.8% before the resumption of the bullish move that started last week at $1,763. At current levels I prefer to be neutral if not bearish. Before weekend I avoid opening new positions. That is why I prefer to wait and see how Monday starts before jumping in the market and before choosing sides.

Analysis are provided by InstaForex
 
Forex Analysis & Reviews: Forecast for GBP/USD on December 8, 2020

GBP/USD
The pound fell by 217 points due to yesterday's news about Prime Minister Boris Johnson's readiness to end the hopeless negotiation process on Brexit. Subsequently, the price won back most of the fall, and the day closed with a black candlestick at 58 points. The MACD line stopped the fall. If the negative Brexit scenario is confirmed (we consider it as the main one), a second attempt to attack the MACD line will be more successful, the target is the 1.3180 level.

The actual target will be the 1.3108 level (November 12 low). The double divergence according to Marlin has worked out, the signal line of the oscillator is about to move into the downward trend zone, which will strengthen the bearish market sentiment.

The four-hour chart shows that the price has settled below the MACD line, yesterday's growth fell slightly short of this line and a reversal is taking place this morning. The first target for support is 1.3290, getting the pair to settle below it will strengthen the decline.

Analysis are provided by InstaForex
 
Forex Analysis & Reviews: Forecast for EUR/USD on December 9, 2020

EUR/USD
Yesterday, the euro dropped another 6 points after losing 13 points on Monday. Brexit negotiations are ongoing, but investors have already quit the recent frenzied speculation. In addition, the European Central Bank meeting will take place tomorrow after which the monetary policy adjustment will be announced, as expected, towards easing. The German trade balance for October will be released today, the forecast for which is 17.0 billion euros against 17.8 billion a month earlier. There is simply no reason for the euro to grow.

The daily chart shows that the price has settled below the target level of 1.2117, the signal line of the Marlin oscillator is heading towards the rising trend zone for the medium term. Getting the price to settle under the line of the increasing green channel in the area of 1.2037 and Marlin's departure into the zone of negative values will change the medium-term rising trend to a downward one. The closest target in this case will be the MACD line in the 1.1934 area.

The four-hour chart shows that the MACD line and the price are closer. Now, getting the price to settle below yesterday's low will correspond to doing so below the MACD line. After that, we are waiting for an attack on 1.2037. Marlin is already in the downward trend zone and is waiting for the price.

Analysis are provided by InstaForex
 
Forex Analysis & Reviews: Forecast for AUD/USD on December 16, 2020

AUD/USD
The Australian dollar took advantage once again of the delay in the offensive of the US currency (or does not believe in it) and went up to 26 points yesterday. But this growth in technical terms has not changed anything, the price divergence with the Marlin oscillator remains, the upper and the lower targets remain unchanged. Today, the Fed's FOMC is more likely to announce a reduction in the QE program or at least an intention to do so in January. Such a statement should cool the ardor of speculators. We are waiting for the decline of the Australian to the nearest support of 0.7500 (low of December 2017), then to 0.7440.

Based on the four-hour chart, the Marlin oscillator does not reduce confidence in the downward trend section, declining in its own channel. The Kruzenshtern line is approaching the target level of 0.7500, this level is of particular importance and its overcoming can provoke an accelerated fall in the price.

Analysis are provided by InstaForex
 
Forex Analysis & Reviews: Ichimoku cloud indicator analysis of Gold

Gold price is once again moving higher above the key resistance of $1,850. If bulls manage to hold above $1,850 and break above recent highs at $1,874, we should then expect a move towards $1,900 and higher.

Gold price has made an important higher low at $1,820 and is now breaking above the Ichimoku cloud once again. This is a bullish sign. Support is at $1,847 and next at $1,820. Gold bulls need to defend these two levels. Breaking below $1,820 will bring Gold price below $1,800. However so far this is not the most probable scenario. The most probable scenario for now is a move above $1,874 towards $1,913-31. Both tenkan-sen (Red line indicator) and the kijun-sen (yellow line indicator) are below price. The Chikou span (black line indicator) is above the candlestick body. This is also bullish. All signs in the 4 hour chart support the bullish case.

Analysis are provided by InstaForex
 
Forex Analysis & Reviews: Forecast for USD/JPY on December 18, 2020

USD/JPY
Yesterday, the yen moved under the target level of 103.18, but failed to settle below it. This morning the price is already above this level and it may not fall towards the target of 102.35. In order to move to the first target along the MACD line in the 104.10 area, there are still no conditions on the lower timeframe. The situation is neutral.

The growth rates are higher, and being able to settle above the embedded price channel line (104.42), paves the way for the price to reach the upper line of the price channel in the 105.70 area, but it is too early to talk about it. There is a 60% probability that the price can return to the area under 103.18 and continue to decline to the target of 102.35.

The four-hour chart shows that the first reversal signal will appear when the signal line of the Marlin oscillator goes into the positive area, and in order to do so the price needs to rise by about 30 points, which will correspond to the price of 103.60, and this is already close to the MACD line (107.75). When making a decision to buy, we recommend that you wait until the price goes above this indicator line. The current situation is not trading.

Analysis are provided by InstaForex
 
Forex Analysis & Reviews: Forecast for EUR/USD on December 23, 2020

EUR/USD
Yesterday, the single European currency fell by 80 pips. Trading volumes were above average, which can already indicate direct sales of the euro. The option with double divergence, which we allowed yesterday, is canceled, since the signal line of the Marlin oscillator has already come close to the border with a negative trend and the transition beyond it will give a new impetus to the decline. The target of the decline is determined by the range 1.1985-1.2040, it is determined by the indicator line of the MACD and the embedded line of the price channel of the weekly timeframe. Breaking the range opens the target of 1.1885 (October 21 high).

On the four-hour scale, the price is fixed under the lines of the balance indicator (red) and MACD (blue) indicator, the Marlin oscillator is declining. We are waiting for the development of a downward trend in the target area.

Analysis are provided by InstaForex
 
Forex Analysis & Reviews: Forecast for USD/JPY on December 25, 2020

USD/JPY
USD/JPY gained 13 points within the trading range of the last three days. Today the Japanese trading floors are open, at the moment the pair is quoted at 103.54, that is, it is already 14 points lower than yesterday's close. Japanese investors seem to be preparing for a negative turn of events from the opening of the new week. We keep our previous forecast that the price will move under the 103.18 level and its successive decline to 102.35.

The four-hour chart shows that the signal line of the Marlin oscillator has already reached the top of its own wedge. Exit from the wedge, respectively, we wait downward, the oscillator will soon leave the negative zone and accelerate the fall.

Analysis are provided by InstaForex
 
Last edited:
Forex Analysis & Reviews: Forecast for EUR/USD on December 28, 2020

EUR/USD
No significant changes in the market over the past four holidays. The market is thin, and after tense expectations about Brexit, investors want to be compensated for their efforts. Therefore, the price breakdown, which we expected earlier, is possible. If there is no breakout, then we are waiting for calmer movement to the first target of 1.1995 - this is the support of the MACD line on the daily chart. For a more stable decline in price, the transition of the Marlin oscillator to the zone of negative values is not enough. This may happen after the quotes drop below 1.2150.

analytics5fe946fb36988.jpg


The four-hour chart shows that the euro's general sentiment is for it to fall, but the signal line of the Marlin oscillator is bent up suspiciously strongly, indicating an intention to enter the positive zone. If this happens, then the price will also surpass the MACD indicator line to the upside, which will entail some more growth in the free roaming area, because the market remains thin. Until it ceases to freely roam around (which will not be long), we are waiting for the downward trend to resume for all indicators.

analytics5fe947131a67c.jpg


Analysis are provided byInstaForex.
 
Forex Analysis & Reviews: Forecast for EUR/USD on December 29, 2020

EUR/USD
The euro gained 32 points on Monday, staying in the range of December 22nd. There are fewer signs of a downside breakout. Perhaps there won't be one, the price will spend the final days of 2020 in the range of 18-21. The price divergence with the Marlin oscillator is still present, the first significant target is determined by the MACD line at 1.1990.

The four-hour chart shows that the price winds up on the MACD line, which is also a sign that the price is in the range. The signal line of the Marlin oscillator is similarly curved around the zero neutral line. If the price moves below 1.2180, it will be a sign of the first attempt to break through.

Analysis are provided by InstaForex
 
Forex Analysis & Reviews: Forecast for AUD/USD on December 30, 2020

AUD/USD
The Australian dollar added 30 points yesterday as the US dollar slightly weakened. Visually, the price shows an intention to reach the target range of 0.7660/75, but the Marlin oscillator is below the lower boundary of its own channel and this factor warns of a high degree of change with this unattainable target.

analytics5febe52a12e57.jpg


The four-hour chart shows that there is an increase above the MACD indicator line, which speaks in favor of growth, but the Marlin oscillator has practically fallen into a horizontal trend, which indicates the weakness of the trend, thereby confirming the technical uncertainty of the daily timeframe.

analytics5febe53ec4bb5.jpg


In this situation, it is advisable to wait for clear signs of a trend reversal. Or, to settle above the 0.7675 level when the alternative scenario has been implemented.

Analysis are provided byInstaForex.
 
Back
Top