InstaForex Gertrude
Active member
Technical Analysis of EUR/USD for July 3, 2020:
Technical Market Outlook:
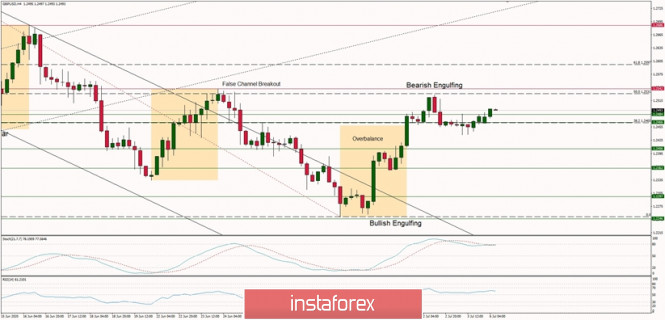
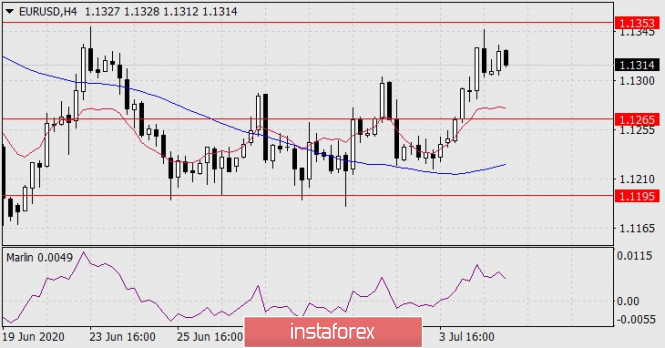
After the EUR/USD pair has made series of Pin Bar candlesticks just above the key short-term support located at the level of 1.1185 some serious bounce has been expected, but it turned out the bulls have a fuel only to rally to the level of 1.1302. Then the Bearish Engulfing candlestick was made and the really reversed. The bulls might still be heading north, so any violation of the level of 1.1302 makes the rally towards the technical resistance located at the level of 1.1347 highly possible, so please keep an eye on the current developments at this market. Please notice the positive market conditions and strong momentum support the short-term bullish outlook. Weekly Pivot Points: WR3 - 1.1484 WR2 - 1.1410 WR1 - 1.1289
Weekly Pivot - 1.1235
WS1 - 1.1124
WS2 - 1.1056
WS3 - 1.0936
Trading Recommendations:
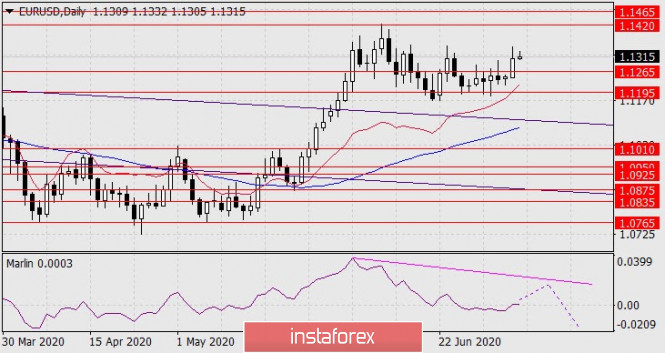
On the EUR/USD pair, the main long-term trend is down, but the local up trend continues. The key long-term technical support is seen at the level of 1.0336 and the key long-term technical resistance is seen at the level of 1.1540. Only if one of this levels is clearly violated, the main trend might reverse (1.1540) or accelerate (1.0336).
Analysis are provided by InstaForex
Technical Market Outlook:
After the EUR/USD pair has made series of Pin Bar candlesticks just above the key short-term support located at the level of 1.1185 some serious bounce has been expected, but it turned out the bulls have a fuel only to rally to the level of 1.1302. Then the Bearish Engulfing candlestick was made and the really reversed. The bulls might still be heading north, so any violation of the level of 1.1302 makes the rally towards the technical resistance located at the level of 1.1347 highly possible, so please keep an eye on the current developments at this market. Please notice the positive market conditions and strong momentum support the short-term bullish outlook. Weekly Pivot Points: WR3 - 1.1484 WR2 - 1.1410 WR1 - 1.1289
Weekly Pivot - 1.1235
WS1 - 1.1124
WS2 - 1.1056
WS3 - 1.0936
Trading Recommendations:
On the EUR/USD pair, the main long-term trend is down, but the local up trend continues. The key long-term technical support is seen at the level of 1.0336 and the key long-term technical resistance is seen at the level of 1.1540. Only if one of this levels is clearly violated, the main trend might reverse (1.1540) or accelerate (1.0336).
Analysis are provided by InstaForex