Wave Analysis from InstaForex

EUR/USD approaching resistance, potential drop!

Price is approaching our first resistance level.
Entry : 1.1227
Why it's good : 76.4% Fibonacci retracement, descending resistance line, 61.8% Fibonacci extension
Stop Loss : 1.1266 Why it's good : horizontal swing high resistance
Take Profit : 1.1180
Why it's good : 38.2% Fibonacci retracement, horizontal overlap support

Analysis are provided by InstaForex
 
Technical analysis of ETH/USD for 28.05.2019

Crypto Industry News:

One of the largest peer-to-peer cryptocurrencies, LocalBitcoins.com, has banned users living in Iran, according to information published on the company's website.

The source previously informed the financial media in an e-mail that the impulse to limit Iranian transactions was to comply with financial regulations in Finland, where the headquarters of LocalBitcoins.com is located. In addition, the stock exchanges allegedly cut off users from Iran because of sanctions previously imposed on other exchanges by the United States.

Coinbase and Binance cryptocurrency exchanges do not currently support users residing in Iran as well.

Technical Market Overview:

The ETH/USD pair might have completed wave (4) and now the market is unfolding the wave (5) to the upside, but the momentum behind the move up is still low. The target for this wave is seen at the level of $304. For now, the market is consolidating the recent gains in a narrow range between the levels of $278.14 - $263.42 as the market participants wait for the breakout.

Weekly Pivot Points:
WR3 - $321.20
WR2 - $292.77
WR1 - $283.99
Weekly Pivot - $254.33
WS1 - $241.65
WS2 - $213.82
WS3 - $203.55

Trading Recommendations:
The best trading strategy in the current market conditions is to buy the local pull-back as wave 4 is in progress in anticipation of the wave 5 to the upside. Please pay attention to the technical resistance at the level of $278.14 as any breakout above this level is bullish. On the other hand, any violation of the level of $226.17 will accelerate the sell-off towards the next technical support at the level of $212.12.

Analysis are provided by InstaForex
 
EUR/GBP approaching resistance, potential drop!

EURGBP approaching resistance, potential drop!
Description :
Price is approaching our first resistance level.
Entry : 0.8852
Why it's good : Horizontal swing high resistance, 61.8% Fibonacci retracement
Stop Loss : 0.8907
Why it's good : 100% Fibonacci extension
Take Profit : 0.8773
Why it's good : 23.6% Fibonacci retracement, horizontal overlap support

Analysis are provided by InstaForex
 
USD/CHF approaching resistance, potential drop!

Price is approaching our first resistance level.
Entry : 1.0096
Why it's good : Horizontal swing high resistance, 38.2% Fibonacci retracement
Stop Loss : 1.0125
Why it's good : Horizontal swing high resistance, 50% Fibonacci retracement
Take Profit : 0.9973
Why it's good : 76.4% Fibonacci retracement, horizontal overlap support

Analysis are provided by InstaForex
 
GBP/JPY approaching support, big potential bounce coming!!

Price is approaching our first support level.
Entry : 137.65
Why it's good : Horizontal swing low support, 61.8% Fibonacci retracement, 61.8% Fibonacci extension
Stop Loss : 136.29
Why it's good : 100% Fibonacci extension
Take Profit : 139.61
Why it's good : 50% Fibonacci retracement, horizontal overlap resistance, 100% Fibonacci extension

Analysis are provided by InstaForex
 
Another failed attempt of the Dollar index capture the 98 price level.

The Dollar index ended last week on a mixed to bearish note as price recaptured the critical resistance at the 98 price level only to lose it with a big decline on the last trading day of the week.

Red rectangle - major resistance
Green rectangle - major support

The Dollar index made new highs on May 23rd but price reversed and did not close above 98. On May 29th and 30th we saw new higher highs but on a closing basis above the major resistance area depicted with a red rectangle. However on the last trading day we saw another reversal. The inability to break above 98 and stay above it, is a worrying sign for bulls. However as long as price is trading above the green rectangle, bulls remain in control of the trend. The many failed attempts point to a bigger reversal in trend, taking into consideration how much time has the index around 98 which is the 61.8% Fibonacci retracement of the entire decline from 103.75 to 88.

Analysis are provided by InstaForex
 
Technical analysis of Bitcoin for 04.06.2019

Crypto Industry News:
The Japan House of Representatives officially approved a new bill to amend national laws regulating the cryptographic industry.

The draft law - prepared by the Japanese Financial Services Agency (FSA) and approved by the House in mid-March this year - was adopted by a majority of votes at the plenary session of the Chamber of Councilors, in accordance with the current update of the FSA on the official website.

The project is aimed at introducing changes to two national laws regarding cryptographic assets - the act on the settlement of funds and the law on financial instruments and exchange. Now that the bill has been adopted, the amended acts are expected to enter into force in April 2020.

The proposed changes to Japanese financial instruments and payment services will ostentatiously tighten the regulation of cryptocurrencies to promote user protection, more stringent regulation of trading in cryptographic instruments, mitigate industry risks, such as stock market busts, and the broad establishment of a more transparent legal framework for new asset classes.

According to earlier reports, the bill also introduces a legal change in the name of cryptocurrencies as "cryptographic assets", previously marked in the country as "virtual currencies". The draft also provides for stricter rules regarding trading in margins, limiting the leverage to double and four times the initial deposit.

Technical Market Overview:
The BTC/USD pair has made another wave to the downside as anticipated. This wave is a part of the wave 4 correction and so far reached the level of $7,739 after all the technical supports were violated. The next target for bulls is seen at the level of $7,484. This corrective cycle might evolve into an ABCDE Triangle pattern as well, so please keep an eye on the further developments.

Weekly Pivot Points:
WR3 - $10,284
WR2 - $9,622
WR1 - $9,121
Weekly Pivot - $8.545
WS1 - $8,037
WS2 - $7,438
WS3 - $6,960

Trading Recommendations:
The best strategy in the current market conditions is to trade in the direction of the main trend, which is still up. All the local bounces and correction should be treated as another opportunity to open the buy orders for a better price. Please notice, the larger time frame trend is up and there are no signs of any trend reversal.

Analysis are provided by InstaForex
 
EURUSD: ECB revised the interest rate forecast. Mario Draghi is pleased with the growth of the economy in the 1st quarter, but fears for its future

The euro ignored data on the growth of the eurozone economy in the 1st quarter of this year, as traders closely followed the ECB report. Even despite the fact that the expected dates for raising interest rates in the eurozone were shifted to the middle of next year, and Mario Draghi signaled a possible decrease in interest rates to a negative level if necessary, the euro held its position and even rose against the US dollar.

According to the report, a good increase in consumer spending in the euro area in the 1st quarter of this year contributed to accelerating economic growth. Export has also made a significant contribution.

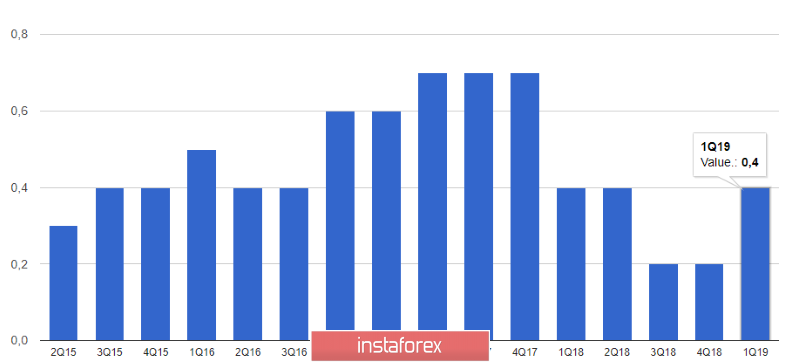
According to the EU statistics agency, the eurozone economy grew by 0.4% in the 1st quarter of this year compared to the 4th quarter. Compared with the 1st quarter of 2018, the economy grew by 1.2%. In annual terms, an increase of 1.6%.

GWBwRpfWHfT-JZaTFpiyBjxBjEmou6fllWZfNuyfFghW7XSlnrtUe4CGkgNoBtkzTrUzj40j_pkpz4QeOFm3Z0Nio6lIIAKWW29PO6YZHdHBZMDkggDxQnHL0HfvIn13DKNvcdXz


However, it is already known from the results of the latest reports that in the 2nd quarter of this year, GDP growth slows down, and, as many experts expect, growth will be the weakest since the beginning of economic recovery in 2014.

As I noted above, the attention of traders was focused on the ECB meeting, at which the regulator left the refinancing rate unchanged, at the level of 0.0%. The European Central Bank left the deposit rate unchanged at -0.40%.

The central bank revised its forecast, saying that rates would remain at current levels, at least until the end of the first half of 2020. The ECB will continue to completely reinvest the income from the QE program over a long period after the first rate increase.

A new TLTRO program was also announced, according to which targeted long-term loans for banks will be offered at a rate of 10 bp above the average refinancing rate.

The euro rose during the speech of the ECB President Mario Draghi, although the statements made by in principal were negative.

Draghi noted that he is closely following how monetary policy affects banks, and is ready to act. If necessary, the ECB will adjust monetary policy instruments. As for the extension of the forecast period of saving rates, it was quite expected due to the long-term uncertainty, which is now observed in the global economy. First of all, uncertainty is associated with conflicts in international trade and changes in the policies of central banks. Draghi also said that the ECB may lower interest rates if necessary.

As for the economy, the head of the ECB is confident that, despite the stronger growth in eurozone GDP in the 1st quarter of this year, the difficulties in the world still put pressure on the prospects for further growth, and the data indicate a slightly weaker growth in the economy 2nd and 3rd blocks.

ECB economists forecast GDP growth in 2019 by 1.2% against the previous forecast of growth of 1.1%, while in 2020 it is expected to grow by 1.4% against the previous forecast of growth by 1.6%.

The ECB president is confident that the increase in employment and wage growth will continue to support the eurozone economy, but the threat of protectionism and geopolitical factors will slow it down.

Analysis are provided byInstaForex.
 
Technical analysis of GBP/USD for 10/06/2019

analytics5cfdeaeb173ac.jpg


Technical Market Overview:

The GBP/USD pair did not make the breakout above the technical resistance at the level of 1.2747, just a local high was made at 1.2761. The market reversed slightly, but there is still no new low made, so the outlook is not certain for now, but due to the face that the short-term trendline dynamic resistance has not been broken as well, the outlook remains bearish. The nearest technical support is seen at the level of 1.2668.

Weekly Pivot Points:

WR3 - 1.2954

WR2 - 1.2856

WR1 - 1.2800

Weekly Pivot Point: 1.2708

WS1 - 1.2658

WS2 - 1.2549

WS3 - 1.1502

Trading Recommendations:

The best strategy in the current market conditions is to trade in the direction of the main trend, which is still down. All the local bounces and correction should be treated as another opportunity to open the sell orders for a better price. Please notice, the larger time frame trend is down and there are no signs of any trend reversal.

*The market analysis posted here is meant to increase your awareness, but not to give instructions to make a trade.
 
USD/JPY to test resistance, a drop is possible!

USDJPY to test key resistance, a drop to 1st support is possible
Entry: 109.012
Why it's good : 61.8% Fibonacci extension, 23.6% Fibonacci retracement, horizontal pullback resistance
Stop Loss : 109.914
Why it's good :50% Fibonacci retracement,horizontal swing high resistance
Take Profit : 107.854
Why it's good: 61.8% Fibonacci retracement, 100% Fibonacci extension, horizontal swing low support

Analysis are provided by InstaForex
 
GBP/USD near support, a bounce is possible!

GBPUSD is near support, a bounce to 1st resistance is possible
Entry: 1.2844
Why it's good : 100% Fibonacci extension, 38.2% & 23.6% Fibonacci retracement, horizontal swing low support
Stop Loss : 1.1256
Why it's good :38.2% & 61.8% Fibonacci retracement,100% Fibonacci extension, horizontal swing low support
Take Profit : 1.1342
Why it's good: 100% Fibonacci extension, horizontal swing high resistance

Analysis are provided by InstaForex
 
Technical analysis of GBP/USD for 14/06/2019:

Technical Market Overview:
After two Pin Bar like candlestick formation around the upper consolidation boundary, the GBP/USD pair keeps trading close to the support zone located between the levels of 1.2652 - 1.2668. The momentum is barely holding the neutral fifty level and it looks like is about to go lower as well. The stochastic is in the middle of the range now, so all sum up there is no direct signal regarding the future price move now, but the support zone is tempting to be violated. In this scenario, the next target for bears is seen at level 1.2605.

Weekly Pivot Points:
WR3 - 1.2954
WR2 - 1.2856
WR1 - 1.2800
Weekly Pivot Point: 1.2708
WS1 - 1.2658
WS2 - 1.2549
WS3 - 1.1502

Trading Recommendations:
The best strategy in the current market conditions is to trade in the direction of the main trend, which is still down. All the local bounces and correction should be treated as another opportunity to open the sell orders for a better price. Please notice, the larger time frame trend is down and there are no signs of any trend reversal.

Analysis are provided by InstaForex
 
USD/CAD approaching resistance, potential reversal!

Price is approaching its resistance where we expect to see a reversal.
Entry : 1.3437
Why it's good : 61.8% Fibonacci retracement, 100% Fibonacci extension, horizontal pullback resistance
Stop Loss : 1.3499
Why it's good : 78.6% Fibonacci retracement
Take Profit : 1.3364
Why it's good : Horizontal pullback support, 38.2% Fibonacci retracement

News are provided by InstaForex
 
EUR/GBP near resistance, a drop is possible!

EURGBP is near resistance, a drop to 1st support is possible
Entry: 0.8982
Why it's good : 100% Fibonacci extension, 78.6% Fibonacci retracement, horizontal swing high resistance
Stop Loss : 0.9063
Why it's good :horizontal swing high resistance
Take Profit : 0.8791
Why it's good: 61.8% Fibonacci extension, horizontal overlap support, 61.8% Fibonacci retracement

Analysis are provided by InstaForex
 
GBP/USD near resistance, a drop is possible!

GBPUSD is near resistance, a drop to 1st support is possible
Entry: 1.2564
Why it's good : 61.8% Fibonacci extension, 23.6% Fibonacci retracement, horizontal pullback resistance
Stop Loss : 1.2660
Why it's good :horizontal pullback resistance, 61.8% Fibonacci retracement, 61.8% Fibonacci extension
Take Profit : 1.2462
Why it's good: 100% Fibonacci extension

Analysis are provided by InstaForex
 
EUR/USD approaching resistance, potential drop!

EURUSD is approaching resistance where we might see a drop in price.
Entry: 1.1448
Why it's good : Horizontal swing high resistance, 100% Fibonacci extension, 23.6% Fibonacci retracement
Stop Loss : 1.1493
Why it's good : Horizontal swing high resistance
Take Profit : 1.1346
Why it's good: 61.8% Fibonacci extension, 23.6% Fibonacci retracement, Horizontal pullback support

Analysis are provided by InstaForex
 
Forecast for GBP/USD on June 25, 2019

analytics5d11a94393ae0.png


GBP/USD
Yesterday, the pound solved the main task for the possibility of further growth - it consolidated above the line of the price channel on the daily chart. The balance line was on top of a strong resistance. The daily Marlin oscillator signal line lies at the horizon, which makes it possible for the pound to continue its slow growth below the balance line and reach the MACD line (1.2832), presumably at the point where both indicator lines coincide. From this point, a reversal or correction is likely.

There is a weak convergence on the four-hour chart on the Marlin oscillator, but nevertheless it is closer in form to consolidation in the growth zone, which may soon continue to increase the indicator and price.

A signal for a reversal will be the departure of the price below the price channel line on the daily chart and below the MACD line (1.2690) at the four-hour price.

Analysis are provided byInstaForex.
 
EUR/GBP approaching resistance, potential drop!

EURGBP is approaching resistance where we might see a drop in price. Entry: 0.8981
Why it's good : Horizontal swing high resistance, 78.6% Fibonacci retracement
Stop Loss : 0.9055
Why it's good : Horizontal swing high resistance

Analysis are provided by InstaForex
 
Technical analysis of Gold for June 27

Gold price has pulled back towards $1,400 as expected and noted in our previous posts. The risk reward ratio did not favor bulls and as the RSI was giving bearish divergence signs, we said that we prefer to take profits and stay neutral when price was above $1,430.

analytics5d13c88d1a4a3.png


Blue lines - bearish divergence
Green line - support trend line

Gold price has pulled back from $1,439 towards $1,400. The bearish divergence warnings by the RSI have been fulfilled. Price has made the minimum required pull back. Price could continue lower towards $1,380-90 area before resuming its up trend. Short-term support is found at $1,410 and resistance at $1.425. Medium-term trend remains bullish. Gold bears will need to break below $1,270-$1,300 area in order to cancel the importance of this bullish breakout.

Analysis are provided byInstaForex.
 
Back
Top