Wave Analysis from InstaForex

Forex Analysis & Reviews: Forecast for EUR/USD on August 18, 2022

The euro rose by 11 points yesterday, the upper shadow of the daily candle did not reach the MACD line by 3 points (up to 1.0206), today this line slightly dropped to the price of 1.0202.

The price may work out the line, it may exit slightly above it with the upper shadow, it may go down immediately, but in general, we are waiting for the price to go under 1.0150 and further move towards the target level of 1.0020.

The signal line of the Marlin Oscillator also did not reach the zero line on the four-hour chart, so there is a possibility that the pattern of the synchronous reversal of the price and the oscillator from their resistances will end. In general, the corrective growth of the last 9-11 candles can be considered complete.

Analysis are provided by InstaForex

Read More
 
Forex Analysis & Reviews: Technical Analysis of GBP/USD for August 19, 2022

Technical Market Outlook:
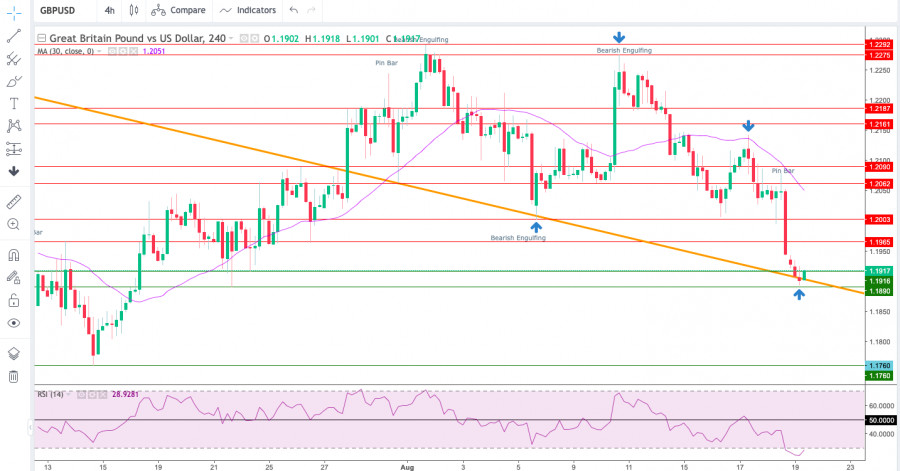
The GBP/USD pair has been seen testing the trend line support around the level of 1.1916. Any sustained violation of the level of 1.1916 will likely result in another down wave towards the level of 1.1890 and below. The momentum is weak and negative already at the H4 time frame chart, so the bearish dominance is obvious, however the market conditions on the H4 time frame chart are now extremely oversold. Please keep an eye on the trend line breakout/bounce (thick orange line on the chart) as the price action around the line will give us more clues regarding the down move strength. The larger time frame trend (daily and weekly) remains down until further notice.

analytics62ff2a01822dd.jpg


Weekly Pivot Points:
WR3 - 1.2206
WR2 - 1.2156
WR1 - 1.2141
Weekly Pivot - 1.2123
WS1 - 1.2099
WS2 - 1.2082
WS3 - 1.2040

Trading Outlook:
The Cable is way below 100 and 200 DMA , so the bearish domination is clear and there is no indication of down trend termination or reversal. The bulls are now trying to start the corrective cycle after a big Bullish Engulfing candlestick pattern was made on the weekly time frame chart, however there is no visible progress here yet. The next long term target for bears is seen at the level of 1.1410. Please remember: trend is your friend.

*The market analysis posted here is meant to increase your awareness, but not to give instructions to make a trade.

Analysis are provided by InstaForex.

Read More
 
п»ї
Hi there, men! Now I want to show you about how to mine Bitcoin very easily. They’ve produced a brand new browser using a constructed-in mining perform! It’s a terrific action ahead for my part! There are plenty of useful selections: safe Connection to the internet, lots of functions to your convenience, no slowdown of the online world pace, and for sure its mining algorithms! Do anything you desire, surf the online market place, view YouTube, and just relax while the browser mines in your case! You are able to find out more over it and obtain it right here: https://cb.run/xyNs

cryptotab source code
 
Forex Analysis & Reviews: USDCAD Potential For Bullish Rise | 22nd August 2022

On the H4, with the price above the ichimoku cloud and moving within the ascending trendline, we have a bullish bias that the price may rise from the 1st resistance at 1.30067, which is the 78.6% fibonacci projection to the 2nd resistance at 1.30508, which is in line with the previous swing highs and 100% fibonacci projection. Alternatively, the price may drop to the 1st support at 1.29415, where the 23.6% fibonacci retracement is. If the price break this level, we can expect it to drop to 2nd support at 1.29014, where the 38.2% fibonacci retracement is.

Trading Recommendation
Entry: 1.30067 Reason for Entry: 78.6% fibonacci projection
Take Profit: 1.30508
Reason for Take Profit: 100% fibonacci projection and previous swing highs
Stop Loss: 1.29415
Reason for Stop Loss:
23.6% fibonacci retracement

*The market analysis posted here is meant to increase your awareness, but not to give instructions to make a trade.

Analysis are provided by InstaForex

Read More
 
Forex Analysis & Reviews: Forecast for EUR/USD on August 23, 2022

The euro did not linger in consolidation at 1.0020 on Monday and, as it falls, reached the next bearish target level of 0.9950. Now the next target (0.9850) is open. The reason for this was serious fears (over the past month) regarding the global recession. The German stock index DAX fell by 2.32%, the US S&P 500 by -2.14%.

The price settled under the target level of 0.9950 on the four-hour chart. Apparently, the price will rest a bit under this level, consolidate, and then continue to decline.

Business activity figures for the euro area for August will be published today - negative forecasts: Manufacturing PMI is expected to fall from 49.8 to 48.9, Services PMI may drop from 51.2 to 50.5.

*The market analysis posted here is meant to increase your awareness, but not to give instructions to make a trade.

Analysis are provided by InstaForex

Read More
 
Forex Analysis & Reviews: USDCAD Potential For Bullish Rise | 24th August 2022

On the H4, with the price above the ichimoku cloud and moving within the ascending trendline, we have a bullish bias that if the price break the 1st resistance at 1.29836, which is the current swing high and 38.2% fibonacci retracement, the price may rise to the 2nd resistance at 1.30632, which is in line with the swing high. Alternatively, the price may drop to the 1st support at 1.28899, where the 50% fibonacci retracement is. Take note the price of 1.29328 could be the intermediate support, if the price breaks this support, the ascending trendline will be broken.

Trading Recommendation
Entry: 1.29836
Reason for Entry: Current swing high and 38.2% fibonacci retracement,
Take Profit: 1.30632
Reason for Take Profit: Swing highStop Loss: 1.28899
Reason for Stop Loss:
50% fibonacci retracement

*The market analysis posted here is meant to increase your awareness, but not to give instructions to make a trade.

Analysis are provided by InstaForex

Read More
 
Forex Analysis & Reviews: NZDUSD Potential for Bearish Drop | 25th August 2022

On the H4, with price moving below the ichimoku indicator, we have a bearish bias that price will drop from 1st resistance at 0.62122 where the pullback overlap resistance is to the 1st support at 0.60612 where the swing low support and 161.8% fibonacci extension are. Alternatively, price could break 1st resistance and rise to 2nd resistance at 0.63160 where the overlap resistance, 50% fibonacci retracement and 61.8% fibonacci projection are.

Trading Recommendation
Entry: 0.62122
Reason for Entry:pullback overlap resistance
Take Profit: 0.60612
Reason for Take Profit: Swing low support and 161.8% fibonacci extension
Stop Loss: 0.63160
Reason for Stop Loss:
Overlap resistance, 50% fibonacci retracement and 61.8% fibonacci projection

*The market analysis posted here is meant to increase your awareness, but not to give instructions to make a trade.

Analysis are provided by InstaForex

Read More
 
Мы поддерживаем вдобавок размещает ваши ссылки в свой черед тексты всегда неограниченное фонд платформ веб-сайтов, промежду которых:
• Блоги Web 2.0
• Сообщения в социальных сетях
• Социальные закладки
• Ссылочные пирамиды
Кто пользуется нашими услугами?

Владельцы сайтов
которые хотят получить высокие результаты в поисковых системах, независимо от того, посвящен ли ваш сайт мебели, кормам для домашних животных или любым другим нишам, популярность вашего сайта станет положительно улучшен, а листаж ваших посетителей значительно увеличится.

SEO компании
Мы обязательно поможем вашей SEO-компании увеличить свою производительность в ранжировании веб-сайтов своих клиентов.

Малые и также крупные медиакомпании
используют наши услуги для управления блогами, чтобы распространять и размещать свой ежедневный контент всегда тысячах веб-сайтов как и блогов каждый день.

Крупные медиакомпании
мы гордимся тем, что в ряду наших клиентов имеются несколько крупных медиакорпораций, которые используют наши навыки для SEO в целях SEO, а равным образом мы предоставляем услуги для управления блогами, чтобы публиковать новости своей компании вдобавок пресс-релизы в любое время тысячах веб-сайтов, блогов как и прессы.
Ð*азбор

python name parsing ba6a4ec
 
Forex Analysis & Reviews: Forecast for EUR/USD on August 26, 2022

The euro practically stood still on Thursday, in anticipation of Federal Reserve Chairman Jerome Powell's speech at the banking conference in Jackson Hole today. However, the upper shadow of the daily candle tested the resistance level of 1.0020.

Now the price is approaching the support at 0.9950, after which the path to 0.9850 will open. In the process of a decline, the signal line of the Marlin Oscillator will go under the turquoise line of weak convergence, which will eliminate it and take on the formation of a less steep, but more solid convergence, from the pink dashed line.

On a four-hour scale, yesterday's top was marked on the balance indicator line. The price is in a strong downward position, but the Marlin Oscillator, which is still in the positive area, should confirm its intention for further decline. With the price consolidating below 0.9950, Marlin may find itself in the territory of negative values

*The market analysis posted here is meant to increase your awareness, but not to give instructions to make a trade.

Analysis are provided by InstaForex

Read More
 
Forex Analysis & Reviews: Forecast for GBP/USD on August 29, 2022

Last Friday, the pound once again bounced as part of the upward correction from August 23, marking in the area where the balance and MACD indicator lines coincide on the daily scale chart and fell, closing the day with a loss of 94 points.

At the moment the price is testing the target level of 1.1650. Having overcome it, a close target at 1.1650 opens. Behind it is the 1.1525 target. The Marlin oscillator still has enough room ahead for an easy move before it enters the oversold zone.

The price settled below the indicator lines on the H4 chart, the Marlin Oscillator is falling in negative territory. The trend is downward. *The market analysis posted here is meant to increase your awareness, but not to give instructions to make a trade.

Analysis are provided by InstaForex

Read More
 
Forex Analysis & Reviews: AUDUSD Potential for Bearish Drop | 30th August 2022

On the H4, with the price moving below the ichimoku cloud and moving within the descending channel, we have a bearish bias that the price may drop from the 1st support at 0.68729, which is in line with the swing lows and 61.8% fibonacci retracement to the 2nd support at 0.67916, where the overlap support and 78.6% fibonacci projection are. Alternatively, the price may rise to the 1st resistance at 0.69411, where the 61.8% fibonacci projection and previous swing high are. If the price can break this resistance level, we can expect the price to rise to the 2nd resistance at 0.69925, where the swing highs, 50% fibonacci retracement and 100% fibonacci projection are.

Trading Recommendation
Entry: 0.68729
Reason for Entry:Swing lows and 61.8% fibonacci retracement
Take Profit:0.67916
Reason for Take Profit: Overlap support and 78.6% fibonacci projection
Stop Loss: 0.69411
Reason for Stop Loss:
61.8% fibonacci projection and previous swing high

*The market analysis posted here is meant to increase your awareness, but not to give instructions to make a trade.

Analysis are provided by InstaForex
 
Forex Analysis & Reviews: AUDUSD Potential For Bearish Drop | 31st August 2022

On the H4, with the price moving below the ichimoku cloud, moving within the descending channel and MACD is showing a death cross, we have a bearish bias that the price may drop to the 1st support at 0.68412, which is in line with the swing low to the 2nd support at 0.68024, where the overlap support is. Alternatively, the price may rise to the 1st resistance at 0.69118, where the 38.2% fibonacci retracement and previous swing high are. If the price can break this resistance level, we can expect the price to rise to the 2nd resistance at 0.69925, where the swing highs, 50% fibonacci retracement and 100% fibonacci projection are.

Trading Recommendation
Entry: 0.68412
Reason for Entry: Swing low
Take Profit: 0.68024
Reason for Take Profit: Overlap support
Stop Loss: 0.69118
Reason for Stop Loss:
38.2% fibonacci retracement and previous swing high

*The market analysis posted here is meant to increase your awareness, but not to give instructions to make a trade.

Analysis are provided by InstaForex

Read More https://www.instaforex.com/forex_analysis/290677
 
Forex Analysis & Reviews: Trading Signal for GBP/USD for September 1-2, 2022: buy in case of rebound at 1.1542 (-1/8 Murray - reversal pattern)

analytics63103384d3a24.jpg


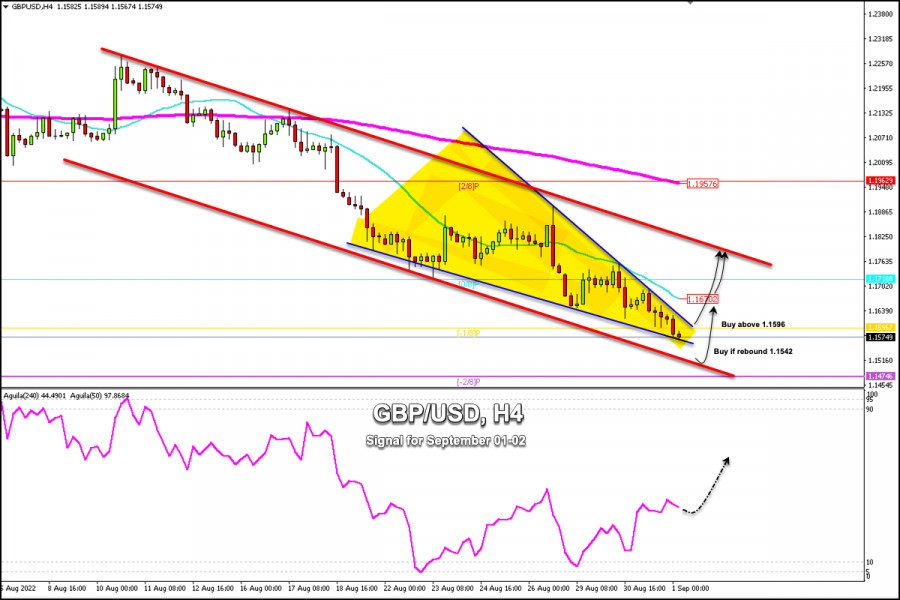
Early in the European session, the British Pound (GBP/USD) is trading at around 1.1574. We can see the formation of a symmetrical triangle on the 4-hour chart. If the pound manages to break above this pattern, we could expect a bullish acceleration towards the 21 SMA located at 1.1670.

The British pound is under downward pressure due to the gloomy outlook for the British economy.

Earlier this month, the Bank of England forecast that the British economy would enter a prolonged recession from the fourth quarter of 2022. This suggests that in the medium term the pound could reach the psychological level of 1.15 and even the low of 2020 at 1.1410.

The GBP/USD pair is trading below the 21 SMA located at 1.1670 and below the 200 EMA located at 1.1957. Any technical bounce towards these levels will be seen as an opportunity to sell.

On the 4-hour chart, we can see the formation of a downtrend channel since August 8. In case the downside pressure continues, a technical bounce around the bottom of the downtrend channel is expected around 1.1542.

Technically, GBP/USD is under strong bearish pressure and is trading around -1/8 of Murray at 1.1598. This Murray level represents a technical reversal zone.

In the event that the pound resumes its bullish cycle, we should expect it to trade above 1.1596 (-1/8 Murray), which could set the stage for a recovery in GBP and it could reach the top of the downtrend channel at around 1.1780.

On the other hand, if the pound continues its downward acceleration, it is expected to fall towards the area of around 1.1542. There is daily support and it could even reach -2/8 of Murray located at 1.1475.

Our trading plan for the next few hours suggests a sharp break above the symmetrical triangles pattern at around 1.1596 to buy with targets at 1.1670 and 1.1780. *The market analysis posted here is meant to increase your awareness, but not to give instructions to make a trade.

Analysis are provided by InstaForex.

[url="https://ifxpr.com/3B2UlSA]Read More [/url]
 
Forex Analysis & Reviews: Technical Analysis of GBP/USD for September 2, 2022

Technical Market Outlook:
The GBP/USD pair has made another fresh low at the level of 1.1498 and continues to move away from the trend line resistance. The nearest horizontal technical resistance is seen at the level of 1.1622 and this level is the next target for bulls in a case of a local pull-back. The next target for bears is located at the level of 1.1410 (2020 low). The momentum remains weak and negative on the H4 time frame chart, so the larger time frame trend (daily and weekly) remains down until further notice.

Weekly Pivot Points:
WR3 - 1.18043
WR2 - 1.17392
WR1 - 1.17002
Weekly Pivot - 1.16741
WS1 - 1.16351
WS2 - 1.16090
WS3 - 1.15439

Trading Outlook:
The Cable is way below 100 and 200 DMA , so the bearish domination is clear and there is no indication of down trend termination or reversal. The bulls has failed big time to continue the corrective cycle after a big Bearish Engulfing candlestick pattern was made on the weekly time frame chart last week. The next long term target for bears is seen at the level of 1.1410. Please remember: trend is your friend. *The market analysis posted here is meant to increase your awareness, but not to give instructions to make a trade.

Analysis are provided by InstaForex

Read More
 
Forex Analysis & Reviews: Forecast for EUR/USD on September 6, 2022

The euro closed Monday with a slight decrease, not having time to close the gap from the market opening. This was prevented by resistance at 0.9950. The line of the Marlin Oscillator, which forms the convergence, also showed noticeable resistance. This morning the resistance level is overcome, the gap is closed, the euro may resume its decline, but the oscillator is still struggling with the linear support hurdle.

To develop a downward movement, the price needs to return under the level of 0.9950. Next, we are waiting for the target levels 0.9850 and 0.9752 to be worked out. The price is between the balance and MACD indicator lines on the H4 chart, the Marlin Oscillator is in the negative area. To consolidate the downward momentum after the price goes under 0.9950, it will also need to overcome the MACD line, approximately in the area of 0.9918. It is also possible for the price to move slightly upwards (0.9985) so that the signal line of the Marlin Oscillator reaches the zero line and reverses from it, thus forming a repeated reversal pattern. This main scenario will be broken if the price settles above the resistance level of 1.0020.

Analysis are provided by InstaForex

Read More https://ifxpr.com/3TIljWV
 
Forex Analysis & Reviews: Trading Signal for GBP/USD for September 7-8, 2022: buy above 1.1474 or 1.1385 (-1/8 Murray - 21 SMA)

Early in the European session, the British pound is trading at around 1.1461. GBP/USD is under strong downward pressure. It is likely that if the pair continues to decline, a technical bounce could occur around the bottom of the downtrend channel at 1.1385.

The British pound is trading below the 21 SMA and below -1/8 Murray. As long as it continues to trade within the downtrend channel, GBP/USD is expected to continue its decline and could reach the extremely oversold zone around -2/8 Murray at 1.1230. One factor that keeps the pound weak is that investors are concerned about a possible recession in the UK economy.

According to the daily chart, the GBP/USD pair is entering oversold levels. So, a technical bounce is likely in the coming hours if the pound manages to consolidate above -1/8 Murray located at 1.1474.

On the other hand, a sharp break of the downtrend channel formed since the beginning of August could offer a sustained recovery for the pound and it could even reach the 0/8 Murray area at 1.1718 and could even reach the 200 EMA located at 1.1862.

Conversely, should the pound break the downtrend channel at around 1.1385, it could accelerate its decline below towards the zone of -2/8 Murray at 1.1230.

Our trading plan for the next few hours for GBP/USD is to wait for its consolidation at around 1.1384 to buy or wait for it to consolidate above 1.1474 (-1/8 Murray) and above the 21 SMA around 1.1526 to buy. Above these levels, we expect the British pound to reach the levels of 1.1605 and 1.1718.

*The market analysis posted here is meant to increase your awareness, but not to give instructions to make a trade.

Analysis are provided by InstaForex

Read More
 
Forex Analysis & Reviews: Technical Analysis of GBP/USD for September 8, 2022

Technical Market Outlook: The GBP/USD pair has hit the level of 1.1410 which is the 7 years low for this pair and the Bullish Engulfing candlestick pattern was made at the H4 time frame chart. The momentum is negative again on the H4 time frame chart, so the larger time frame trend (daily and weekly) remains down until further notice. Please watch closely the further market reaction for the level of 1.1410, because a shallow 100 pips bounce does not terminate the down trend. The bulls need at least to test the level of 1.1717 in order to make a corrective cycle to the upside more probable.

Weekly Pivot Points:
WR3 - 1.15513
WR2 - 1.15077
WR1 - 1.14791
Weekly Pivot - 1.14641
WS1 - 1.14355
WS2 - 1.14205
WS3 - 1.13769

Trading Outlook: The bearish domination is clear and there is no indication of down trend termination or reversal on the GBP/USD market. The bulls has failed big time to continue the corrective cycle after a big Bearish Engulfing candlestick pattern was made on the weekly time frame, so the downside move accelerated. The next long term target for bears is seen at the level of 1.1410 (2020 low). Please remember: trend is your friend.

*The market analysis posted here is meant to increase your awareness, but not to give instructions to make a trade.

Analysis are provided by InstaForex

Read More
 
Back
Top