
PapiaKhatunAsha
Member
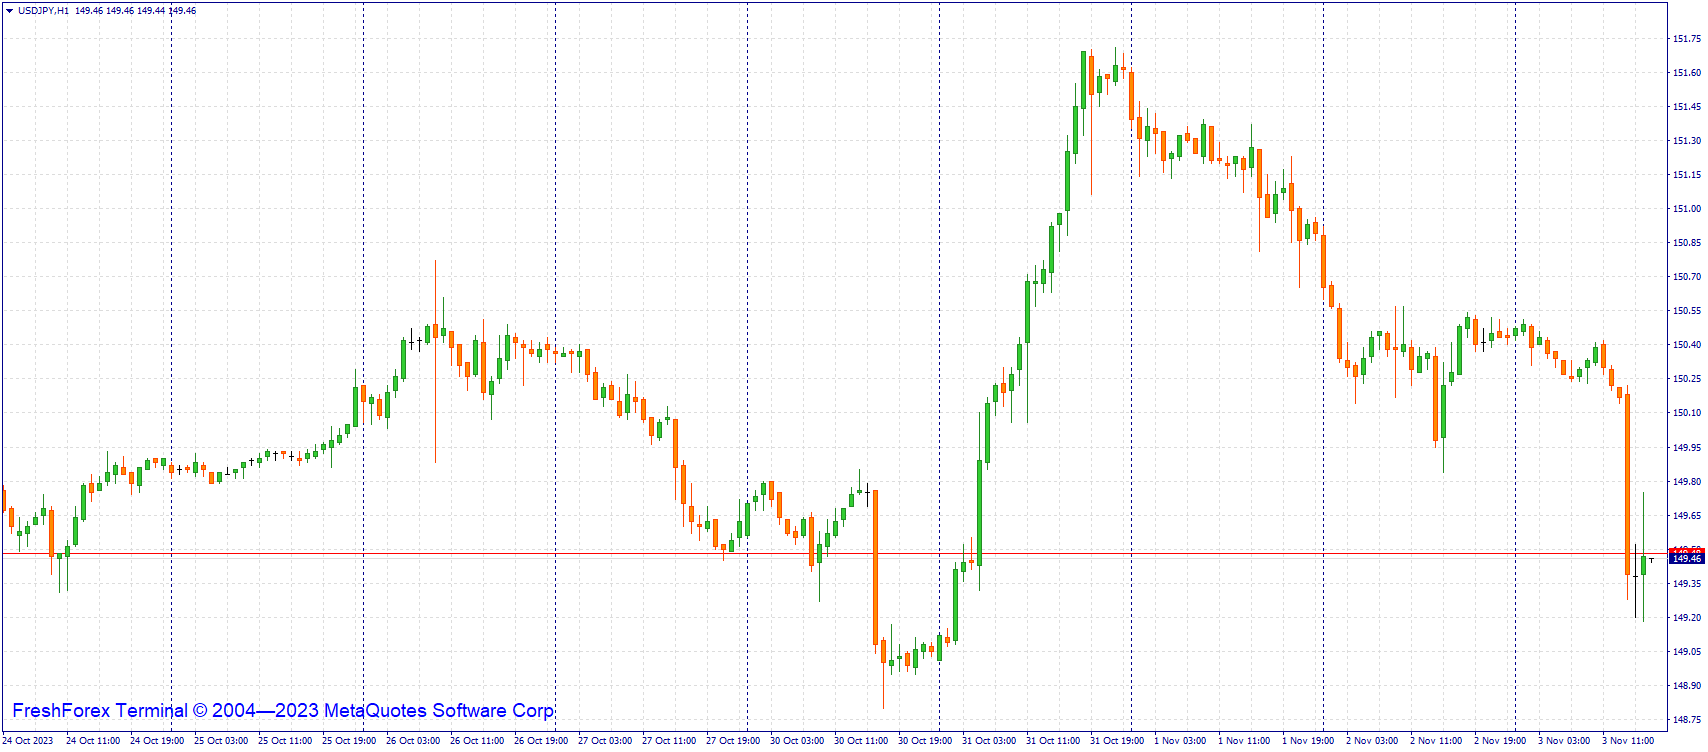
Today, the USD/JPY pair fell from 150.50 to 149.30, testing the MA (200) and H1 (150.20) moving averages on the hourly chart. On the 4-hour chart, the pair tests the MA (200) and H4 (149.40). Support at 148.80 could prevent a further price decline. Above this level, a fall to 148.15 is possible. The upper limit of 151.70 represents the resistance level.
⦁ Resistance levels are 150.80, 151.70, and 152.00.
⦁ Support levels are 148.80, 148.15, and 147.30.
The main scenario for this pair suggests a breakout of the resistance at 150.80 (October 26 high) and a possible rally to 151.70 (October 31 high).
An alternative scenario suggests a fall to 148.80 (October 30 low) and a further fall to 148.15 (October 10 low).